 Repetition Variation Evolution © Invader 2017
Market figures through auction from the last five years reveal a period of growth and correction in the Urban & Contemporary print market. Here’s the latest findings from our print market value index on Banksy, Invader, Opie, KAWS & Stik.
Unsurprisingly, over the last five years, the Banksy market has demonstrated a healthy correction amidst market turbulence in 2022 and his prints remain a viable investment asset. Read below for our Urban & Contemporary market overview.
Download our complete 2023 Print Market Report here, to explore expert opinions on the prints and multiples market over the last five years.
Data-Led Art Investment
Our value index blends public auction data and private sales data from our collectors network. Our market value index uses artwork & artist data and a Repeat-Sales Regression (RSR) approach. Using the sale price of individual prints to estimate the fluctuations in the value of an average representative print over a unique period of time.
Our algorithm tracks over 48,500 auction histories & our own private sales data across 3,500 artworks spanning 30 years, including signed, unsigned, APs, PPs, TPs and sets of prints & editions.
We use several metrics when comparing artists:
- Market Size: the total value in sales in £GBP over a given period.
- Transaction Volume: the total number of sales over a given period
- Average Sales Price (ASP): the average price of a sale over a given period.
- CAGR: the Compounded Annual Growth Rate - a measurement used to smoothen the annual rate of growth over a given period.
- YoY: year over year - a direct comparison between the latest year and previous year.
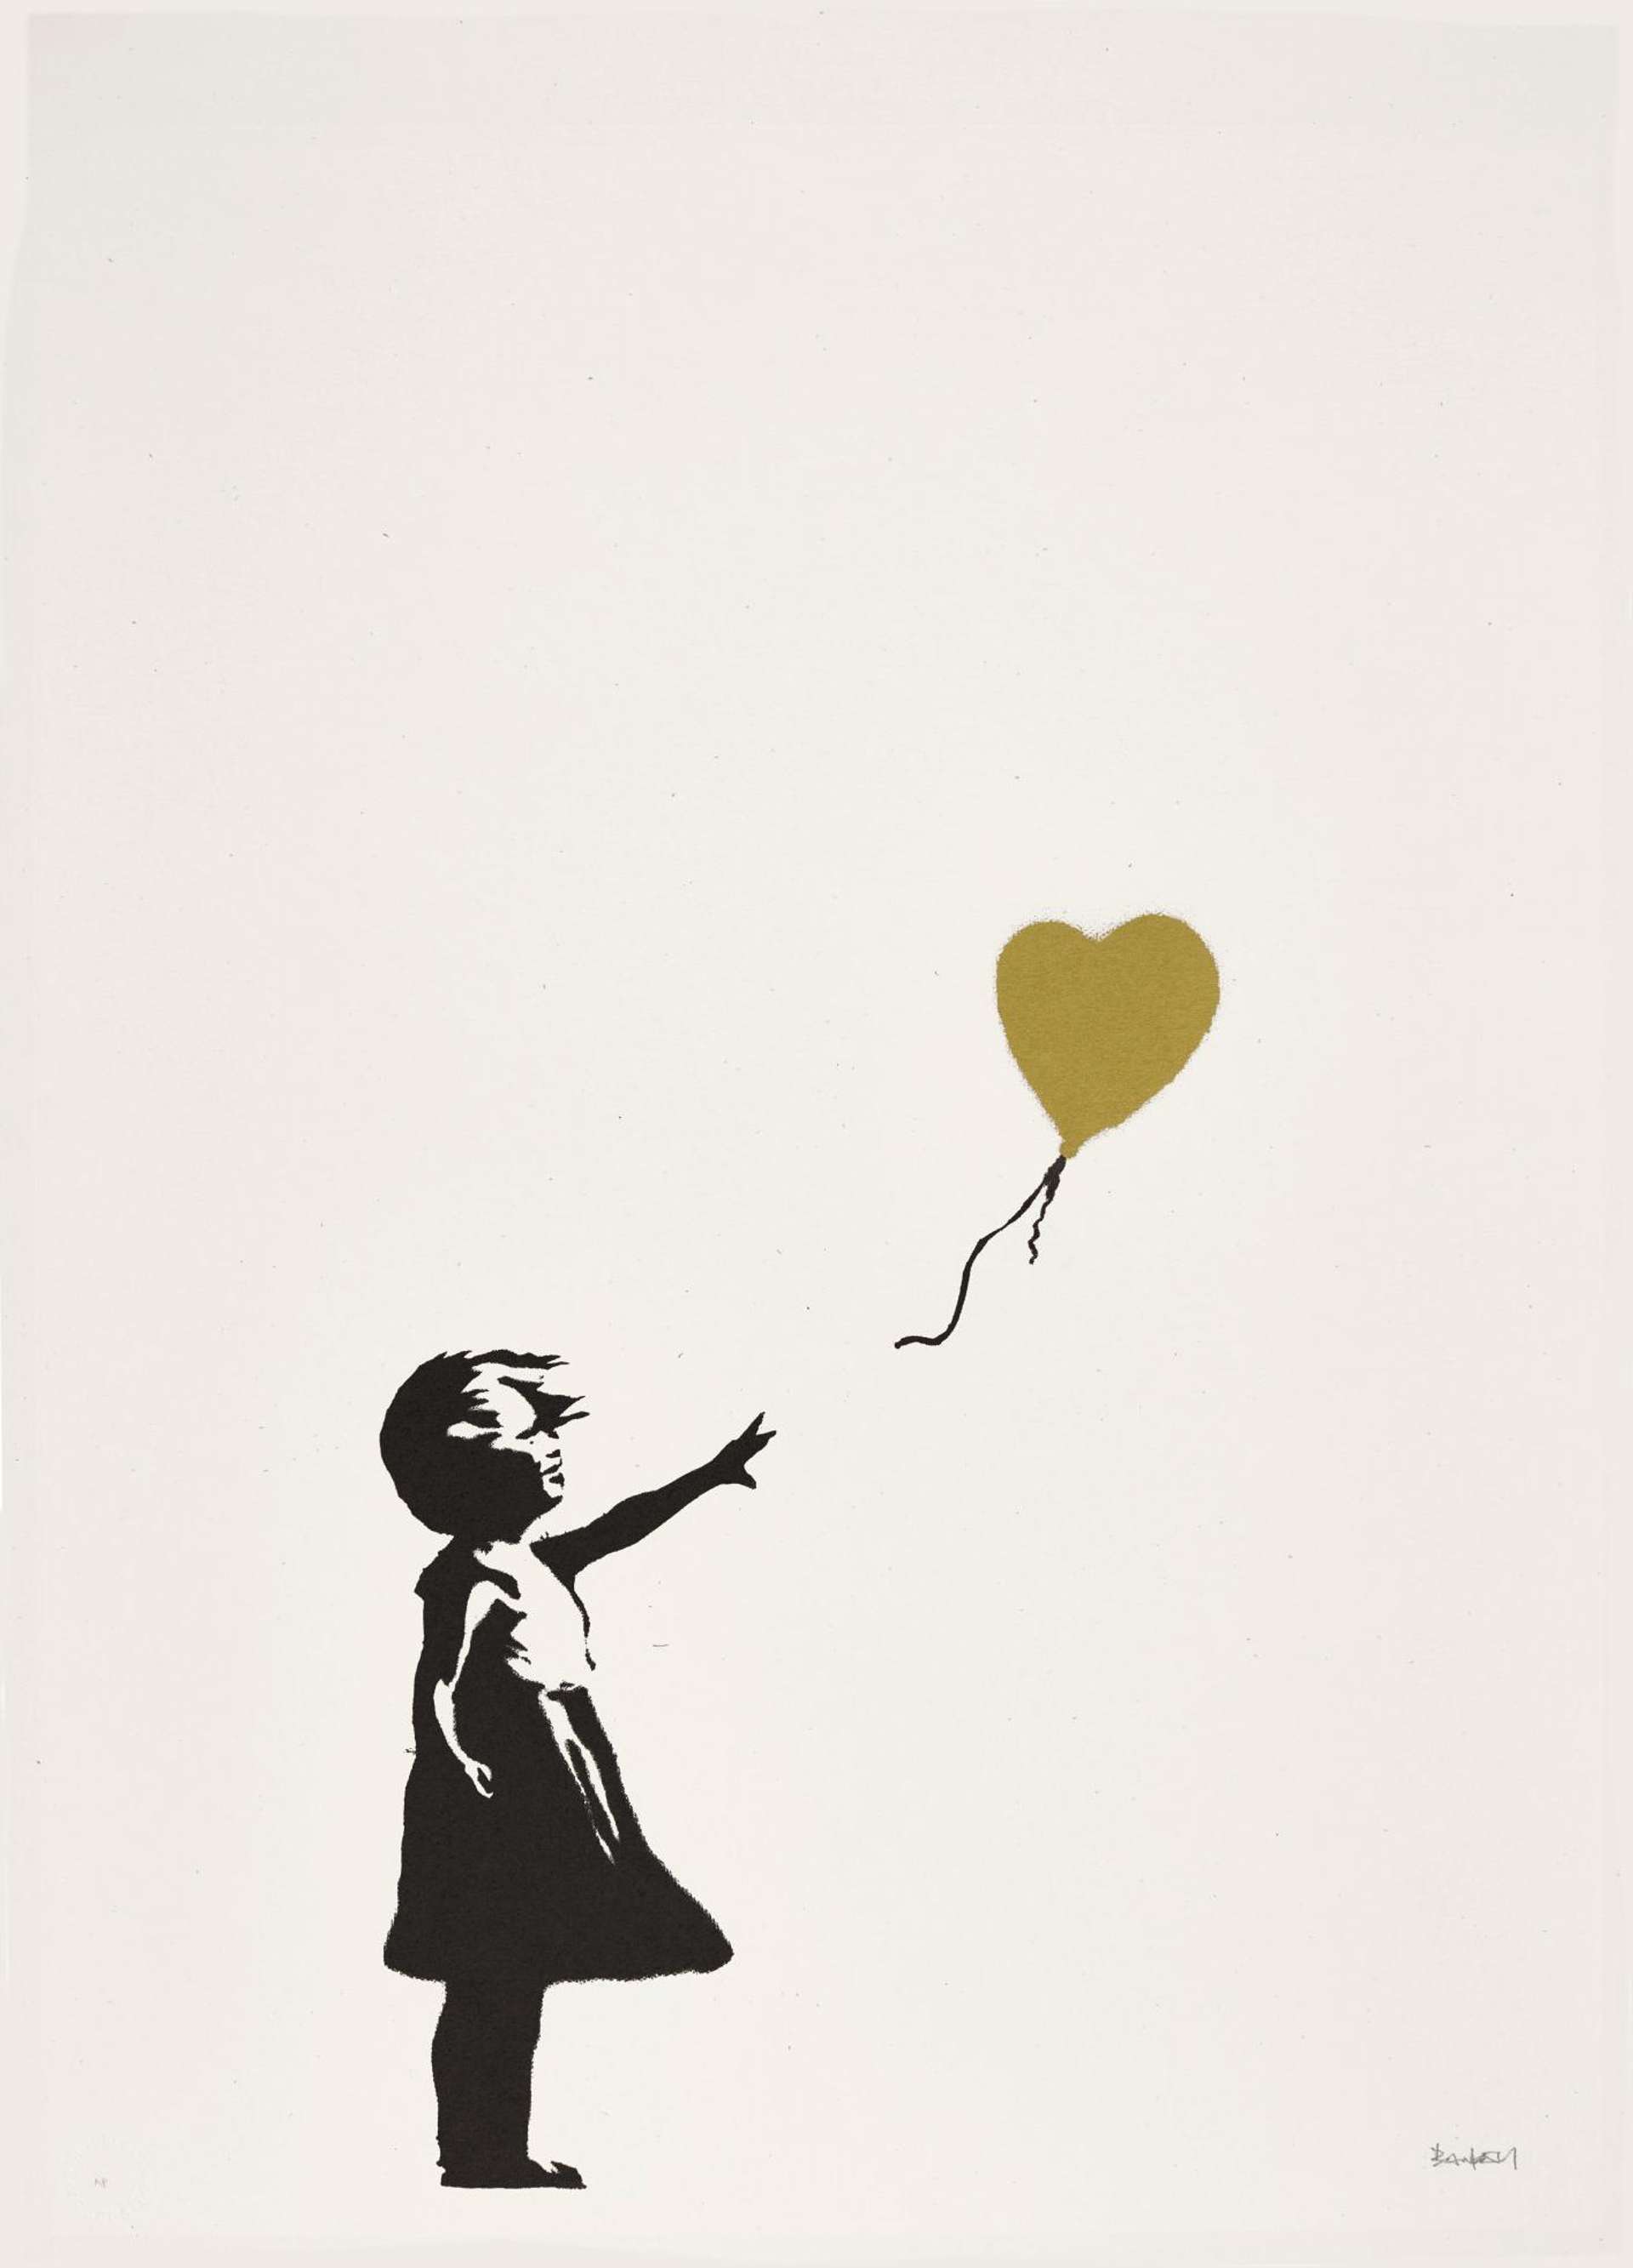
The Banksy Market Matures
Now an established market that has been around for over 15 years, the Banksy print market had a phenomenal run through 2020 and 2021. 2022 saw the Banksy market make a correction after incredible growth in the three years prior. But what has been the nature of that correction and where do Banksy sales look likely to go from here?
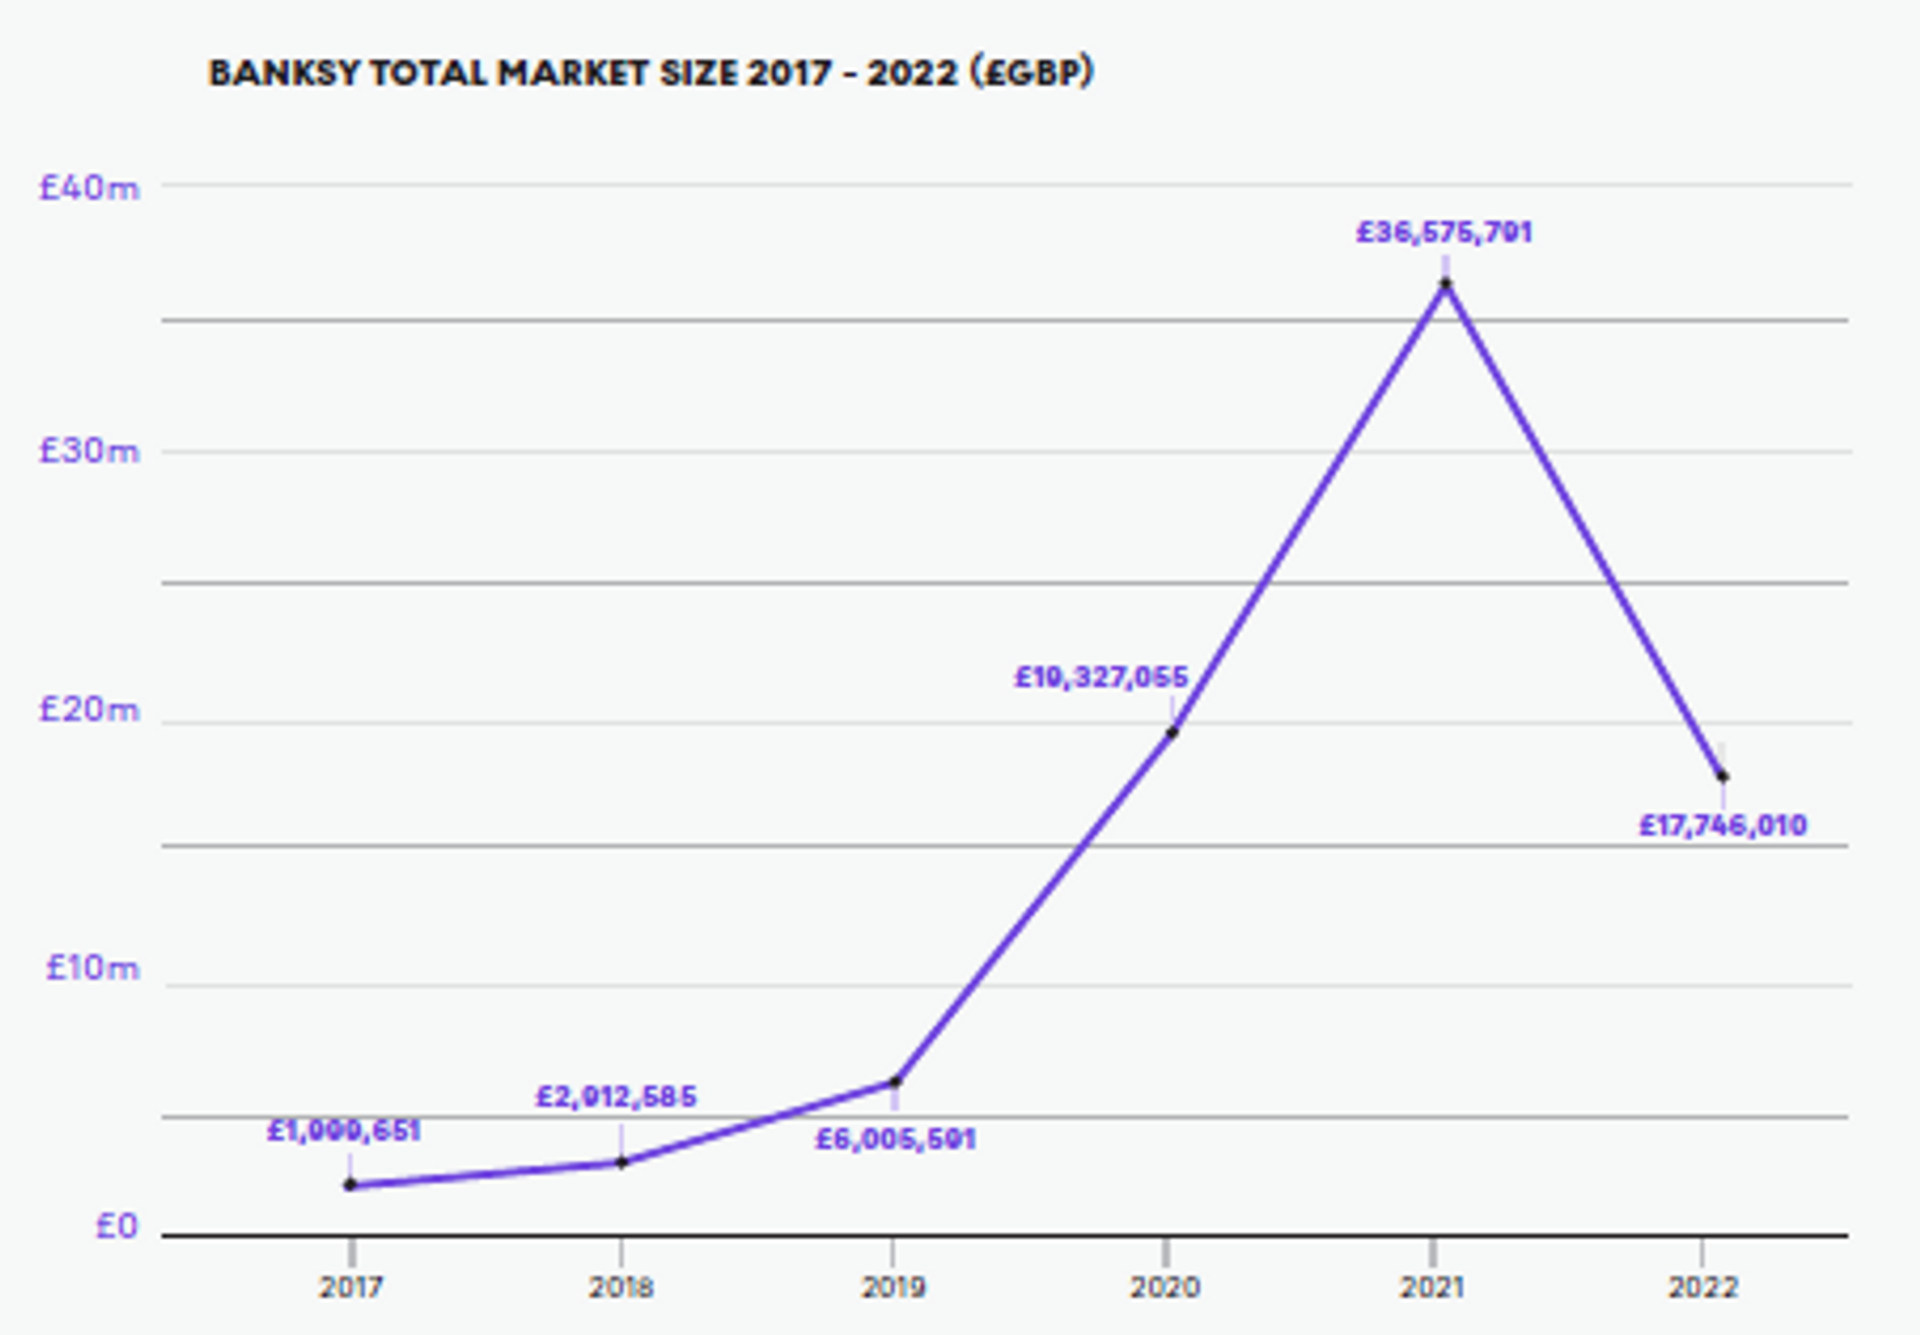 Banksy’s Total Market Size in £GBP
In 2022, the Banksy market has contracted in part due to the volume of sales (-40% YoY) and in part due to the reduction in ASP (-19% YoY).
Volume has been the main driver in the fall in market size; whilst the drop in ASP is significant YoY at 19% - in comparison to the 2020 average - the drop is just 5%.
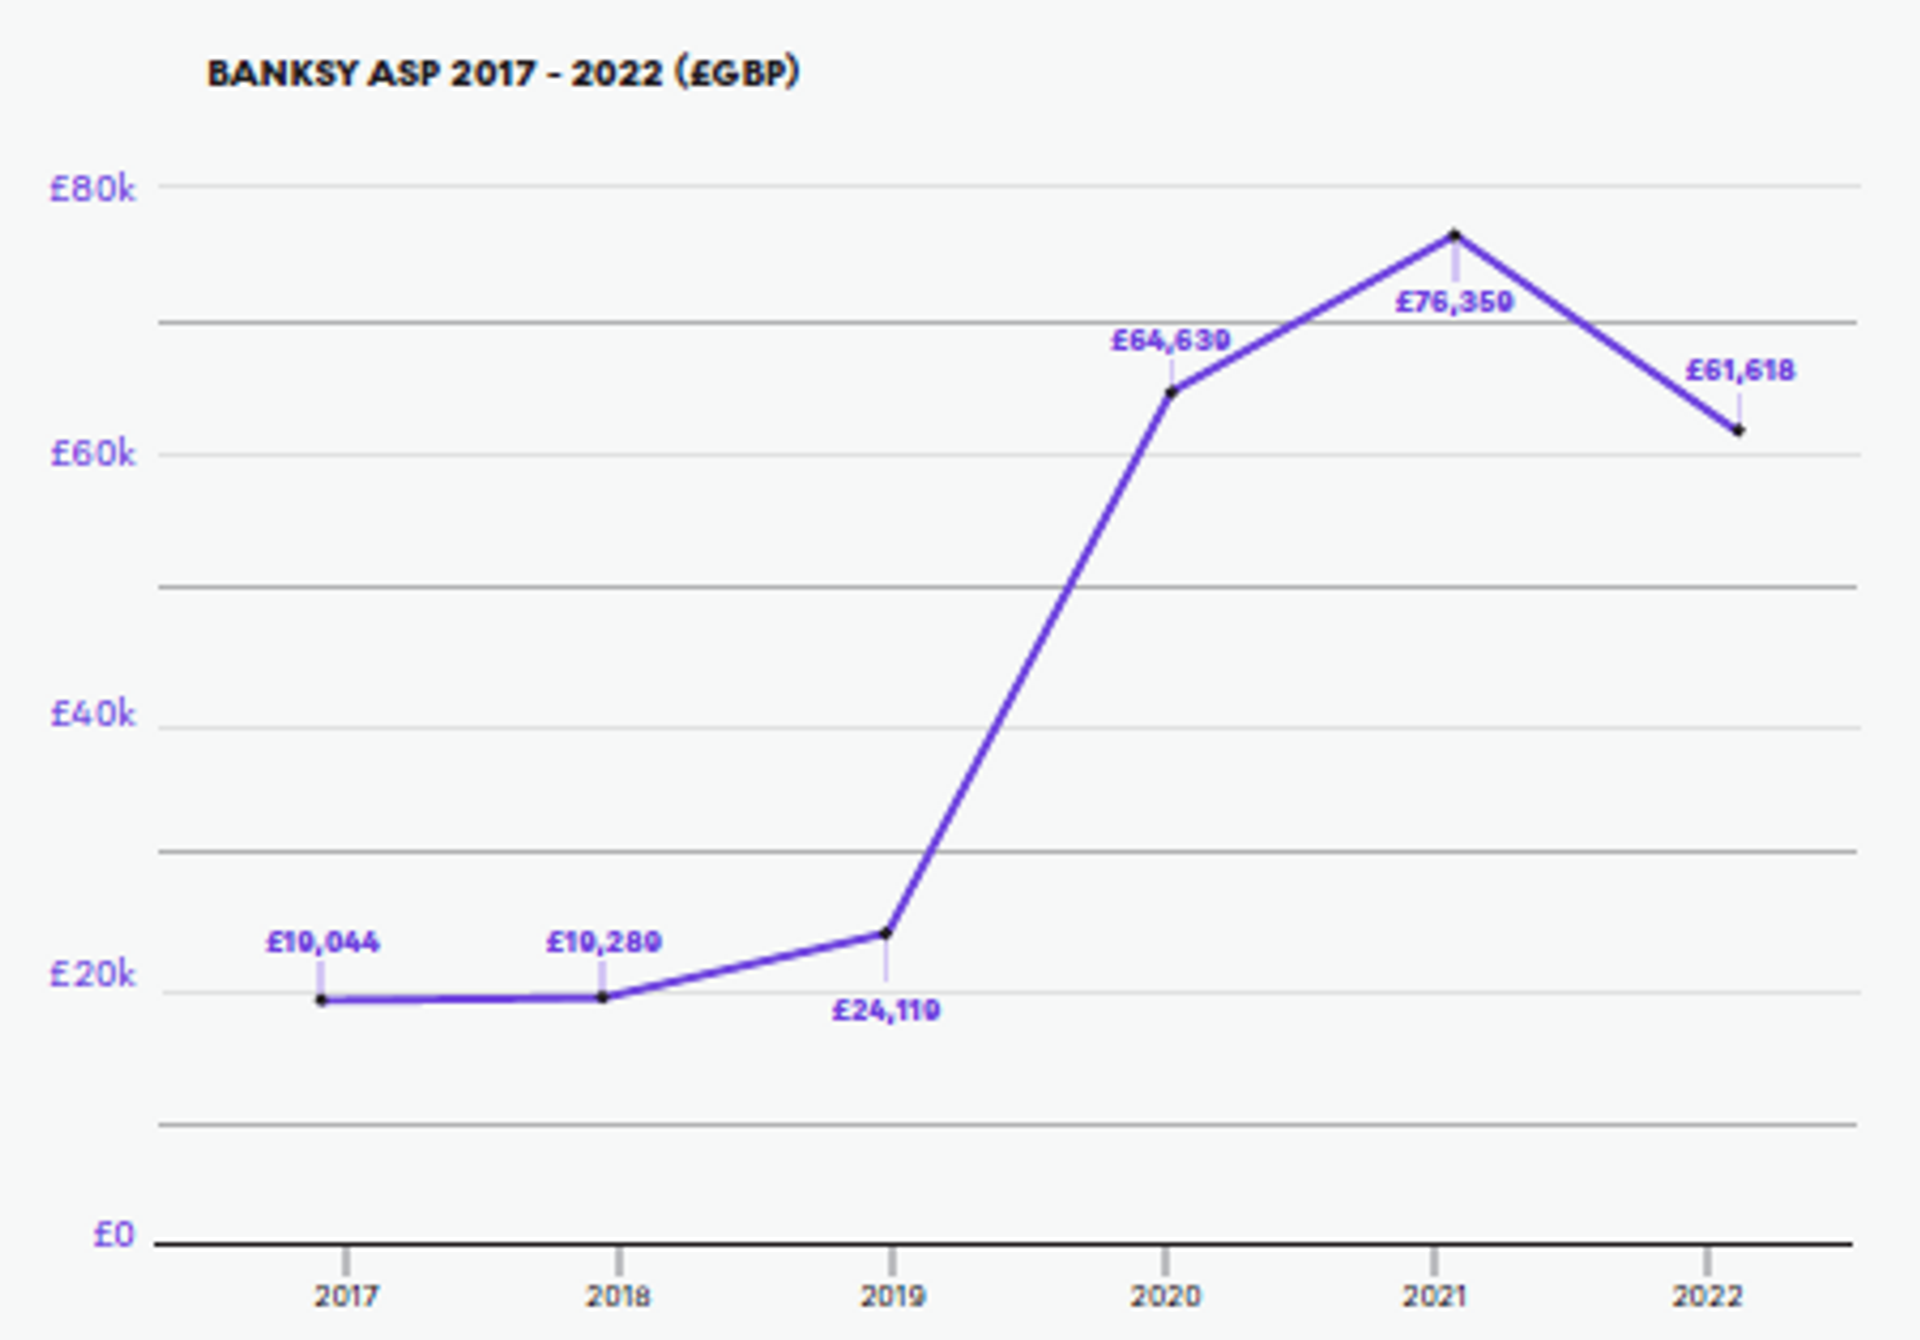 Banksy ASP £GBP
ARE BANKSY PRINTS A GOOD INVESTMENT?
Despite the overall market contraction, the data highlights some interesting points.
Firstly, the 5 year CAGR for the market - even at 50% of the value of 2021 - is still 787%. The ASP 5 year CAGR is 26%, slightly higher than Andy Warhol.
The question is whether ASPs will now stabilise over the coming 6 months; the contraction in the volume of sales in this case would be considered a positive, potentially increasing the competition for available works.
Certainly, 2019 through 2021 saw frenetic trading of Banksy’s works with collectors and investors capitalising on significant profit opportunities in intervals of weeks and months rather than years. This flurry of activity led to an overheated market in 2021, which the global conditions of 2022 have brought to a head, slowing activity and adjusting values downwards.
Banksy looked, briefly, to be alone in having a huge surge in print values during 2020 when elsewhere in the print market largely the opposite was happening, even with superstars like Warhol and David Hockney. This is a testament to Banksy’s appeal as one the world’s leading contemporary artists, and the ease at which his prints can be traded online. In short, the Banksy market may be maturing towards a tendency for mid-to-long term investment, rather than quick-fire trades of 2020. This is in fact more natural than many think in establishing a market for the long term.
Banksy remains as relevant and popular as ever, as evidenced by the response to his recent activity in Ukraine.
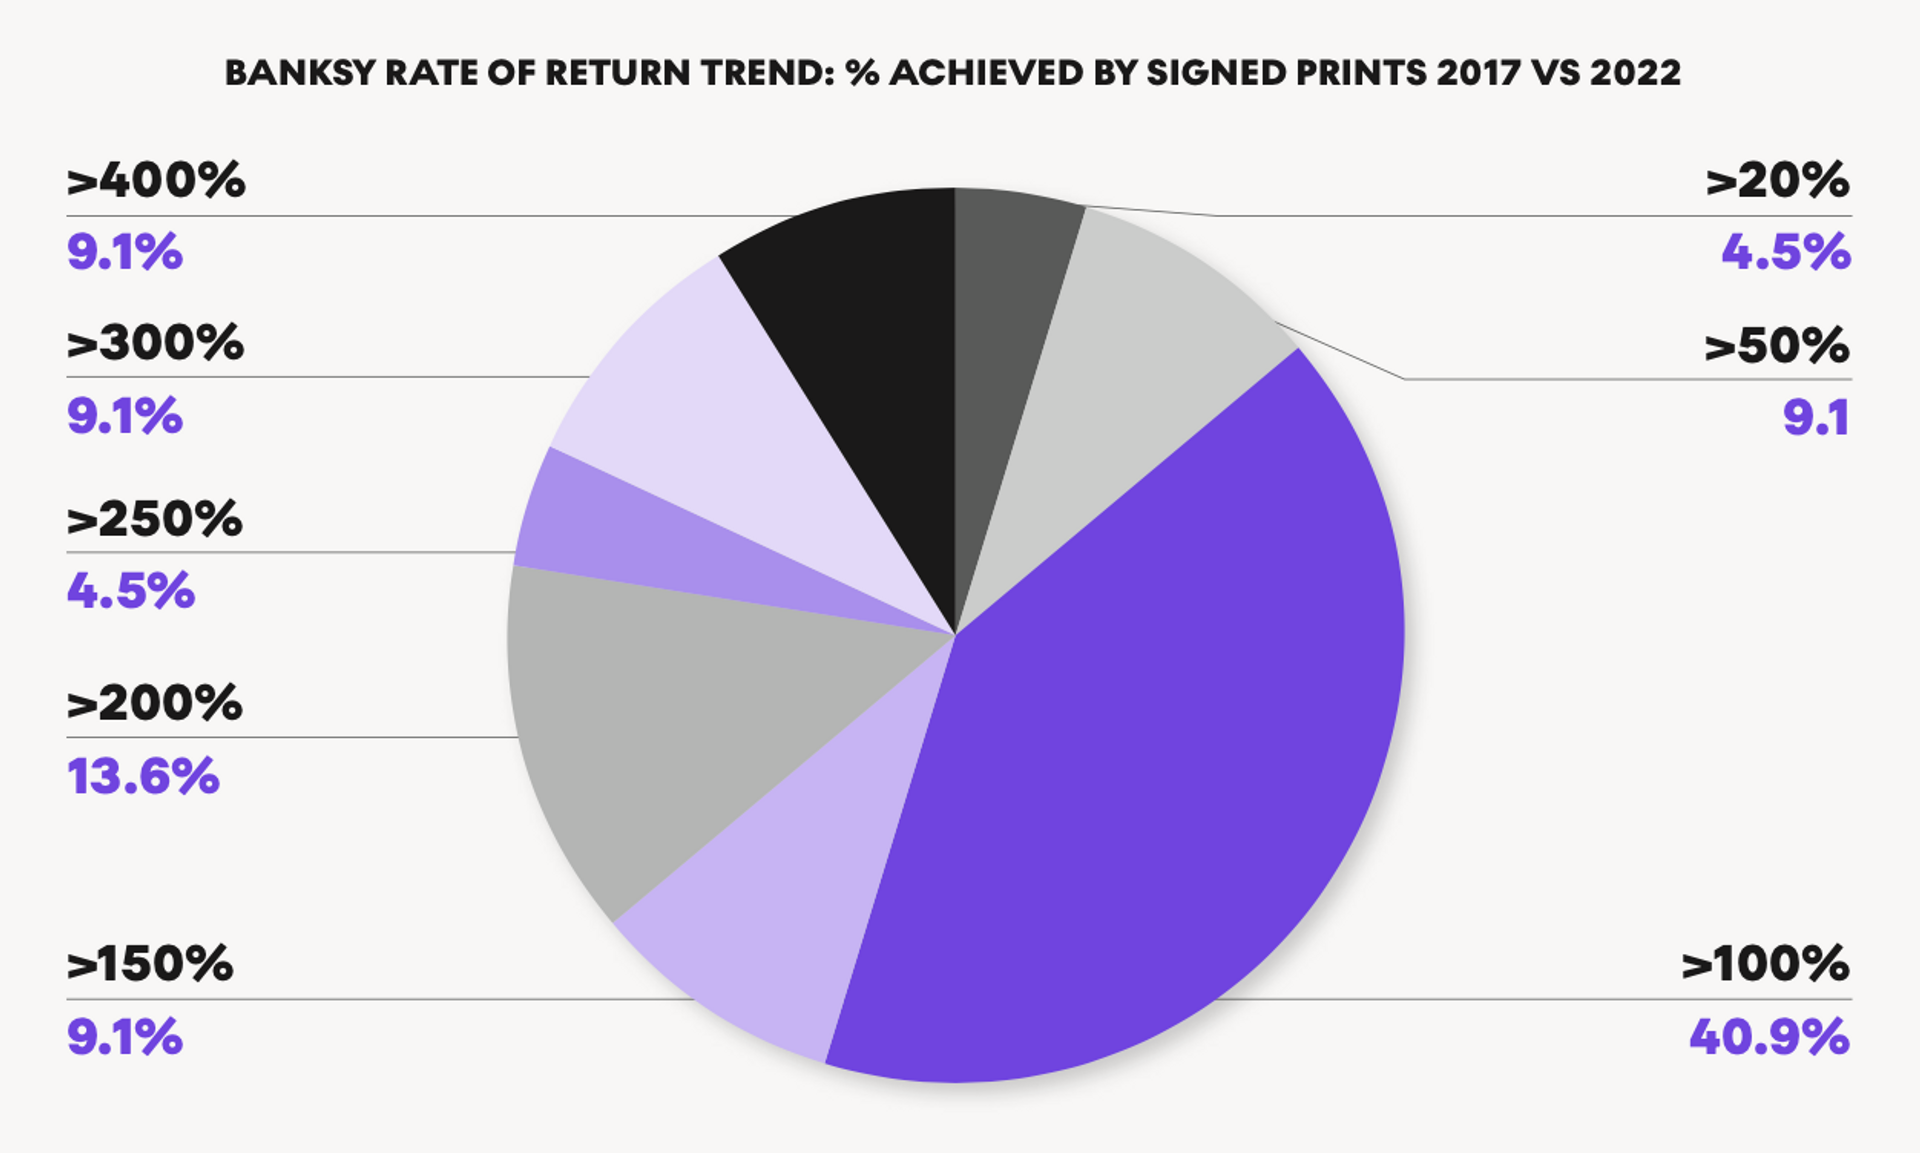 Banksy Rate of Return Trend: % Achieved by Signed Prints 2017 vs 2022
BANKSY PRINTS AS ALTERNATIVE ASSETS
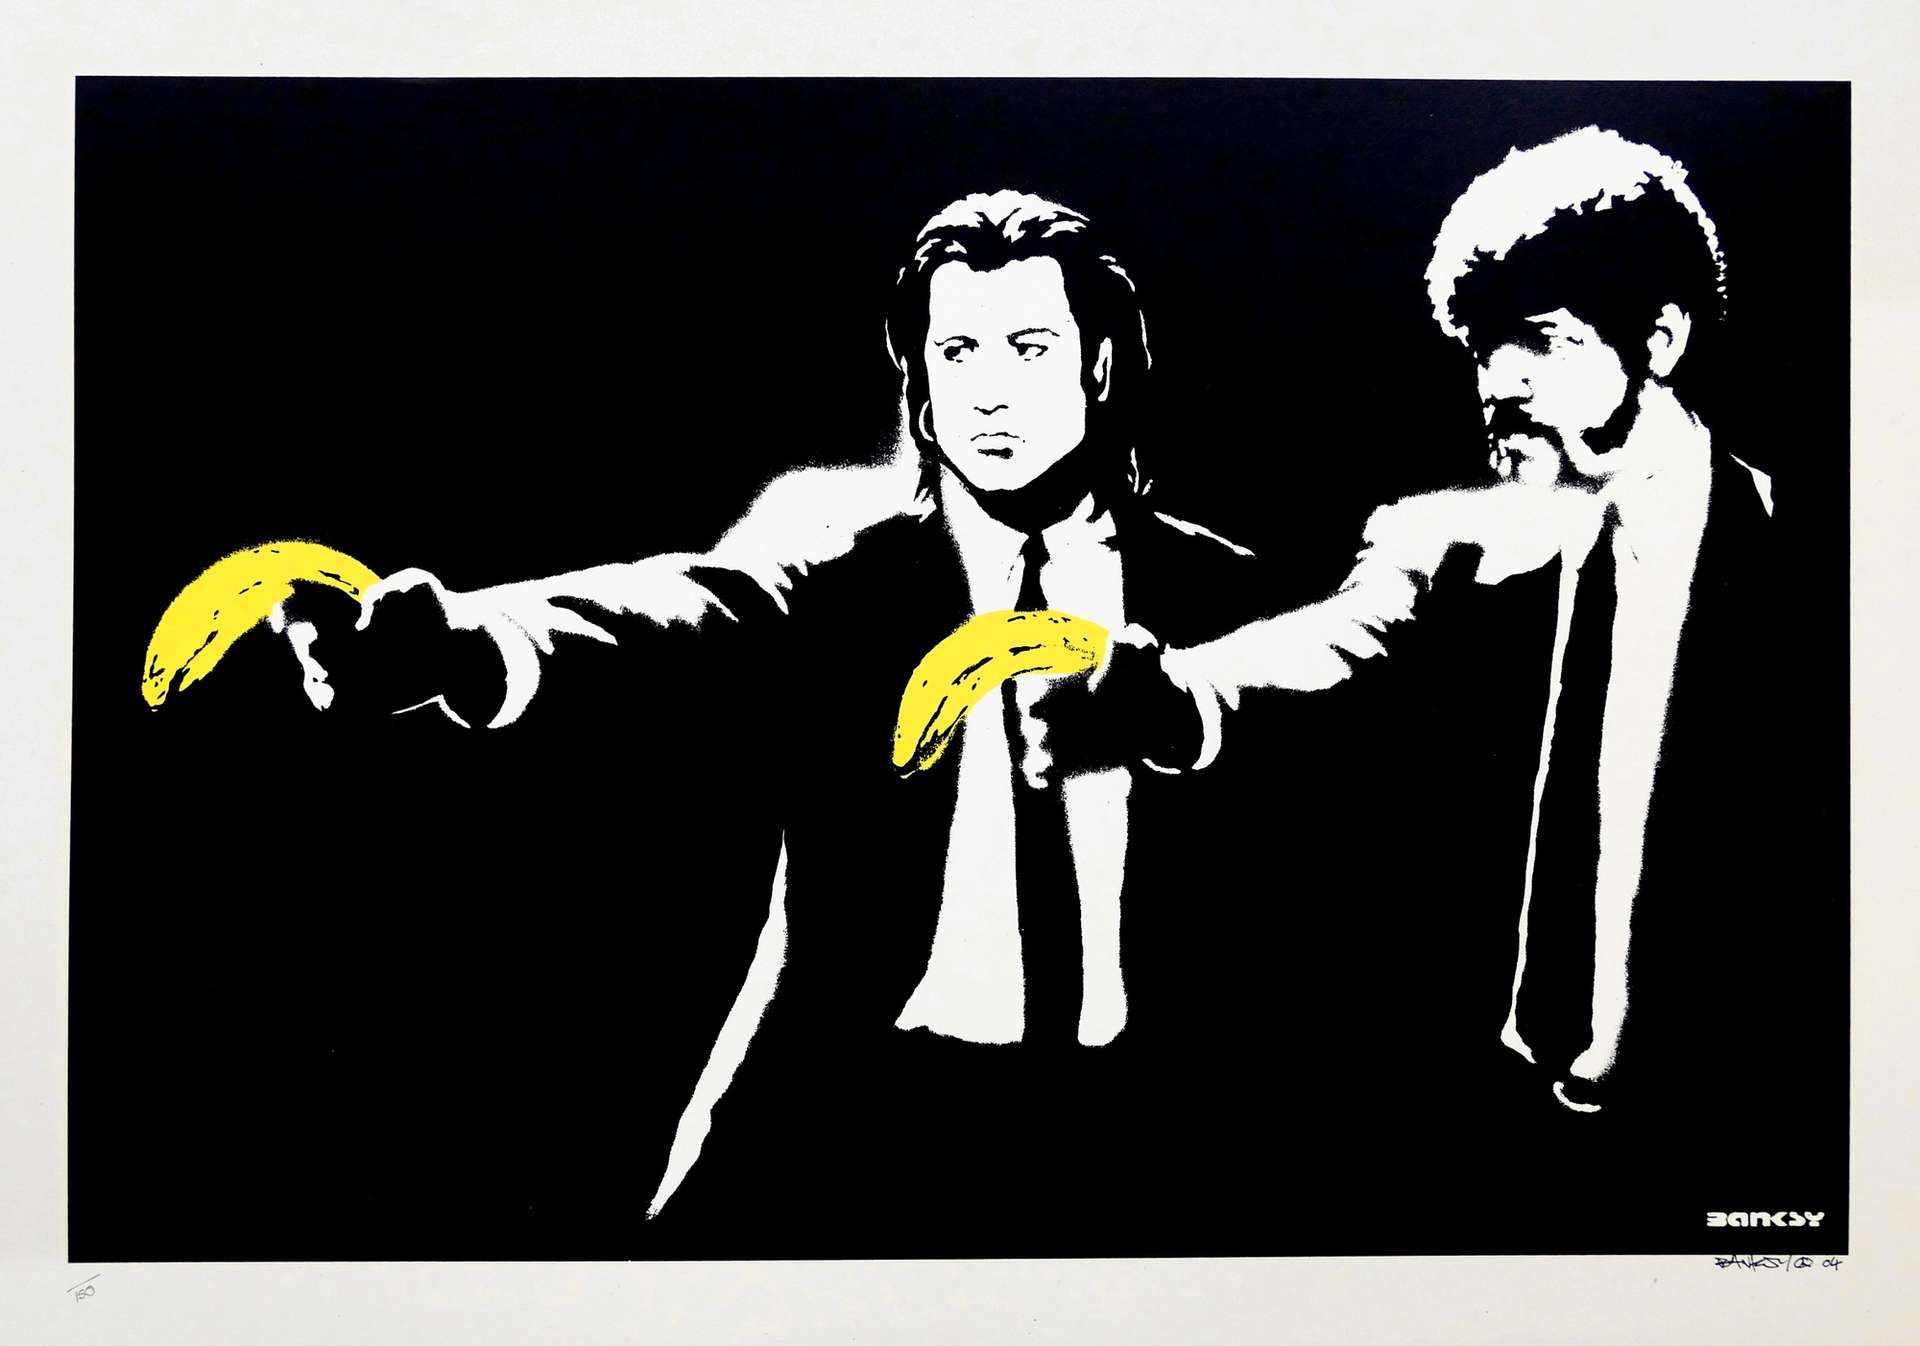
Banksy prints continue to show high returns over 3, 4, and 5 year periods. Pulp Fiction (unsigned) saw a 635% return over 5 years and 49% CAGR, selling for £6000 in 2017 and increasing to £44,100 in 2022. Jack & Jill (signed) saw a 721% return over 4 years and 69% CAGR, selling for £8750 in 2017 and increasing to £71,802 in 2022. Jack & Jill (signed) also saw the top Banksy artwork return over a three year period at 576% and with a 89% CAGR, selling for £10,625 back in 2017.
Browse Banksy prints.

Invader: A Market for First Time Investors
Rising star Invader has been on a 5-year run. Progress has slowed in 2022, but due mostly to a contraction in sales volume rather than ASP. Nonetheless, Invader showed resilience during 2020 and is likely to increase his fanbase as he increases in fame, yet remains affordable.
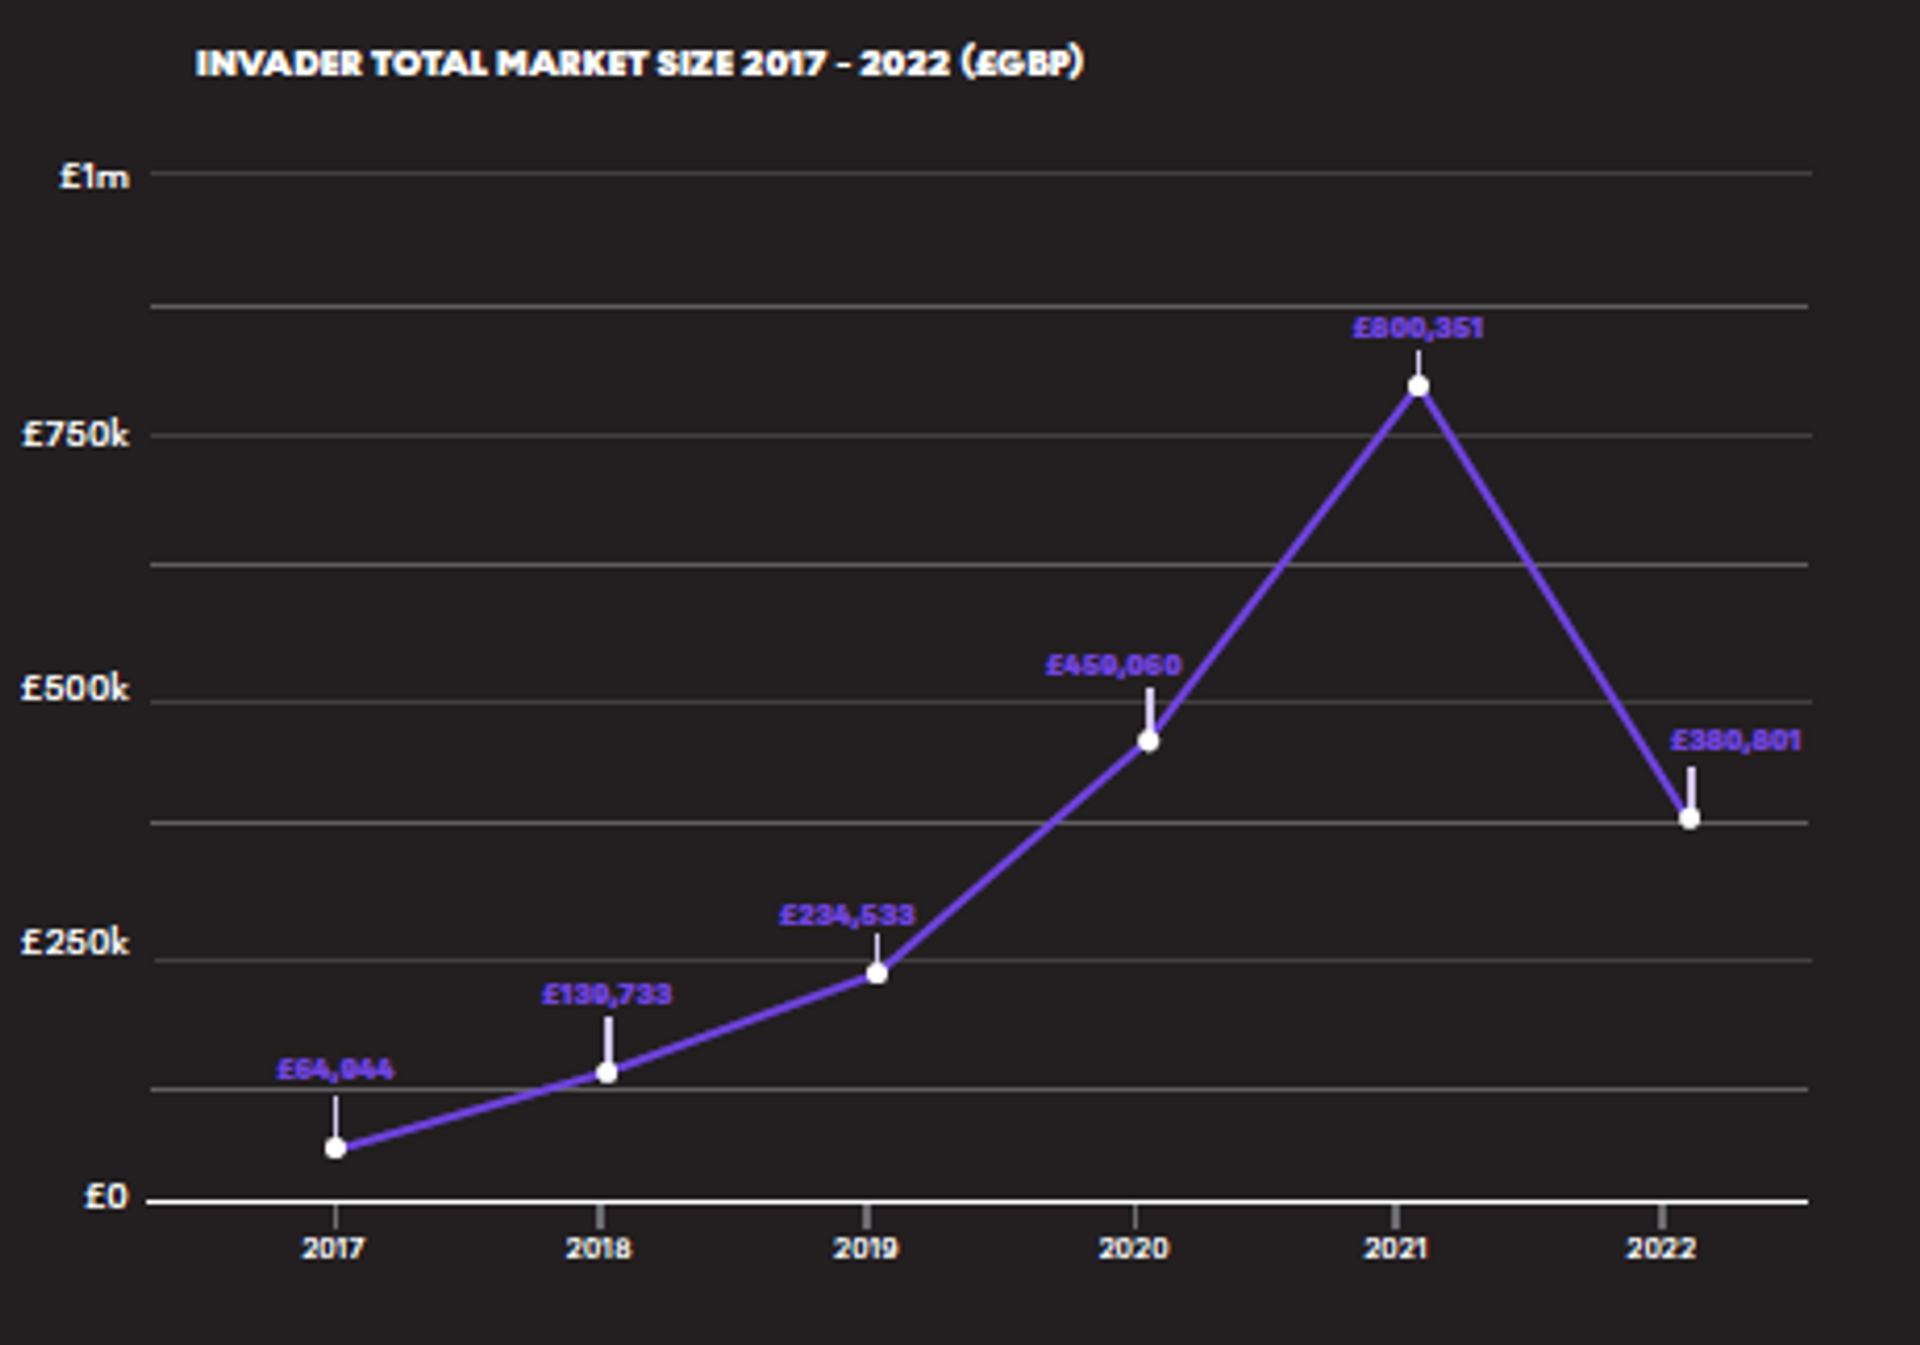 Invader Total Market Size £GBP
Although 2022 has seen the market size of Invader shrink by 52% YoY, when his works do come up at auction, they sell, showing only a 6% decrease in ASP YoY.
When looked at from an ASP CAGR perspective, over 5 years growth stands at 16% with the average return on a print bought in 2018 at 108% over 5 years.
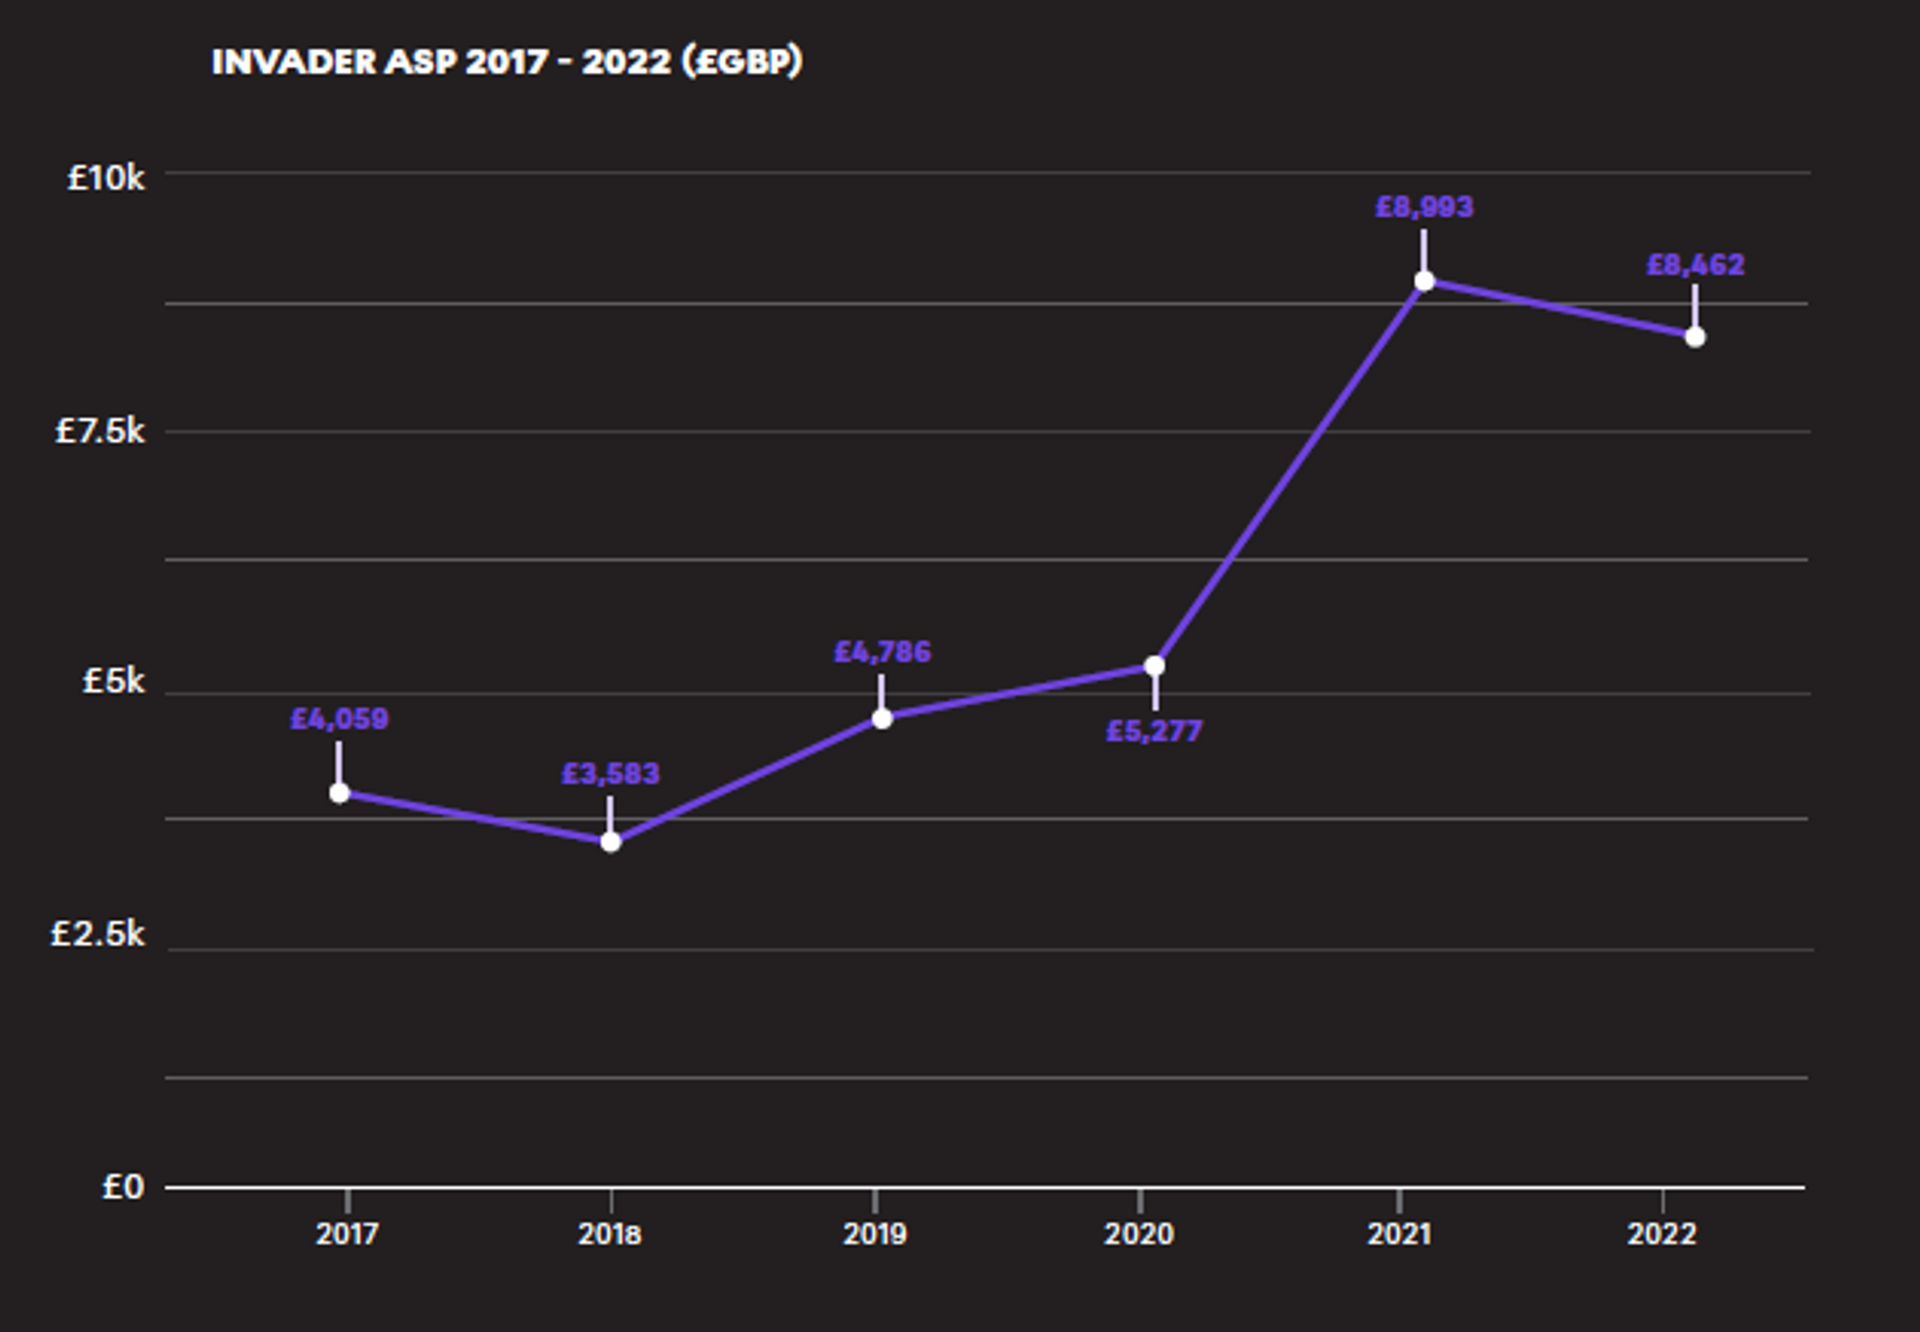 Invader ASP £GBP
Invader’s low entry price point and strong ASP CAGR make him an interesting proposition for collectors looking to enter the Urban market.
Browse Invader prints.
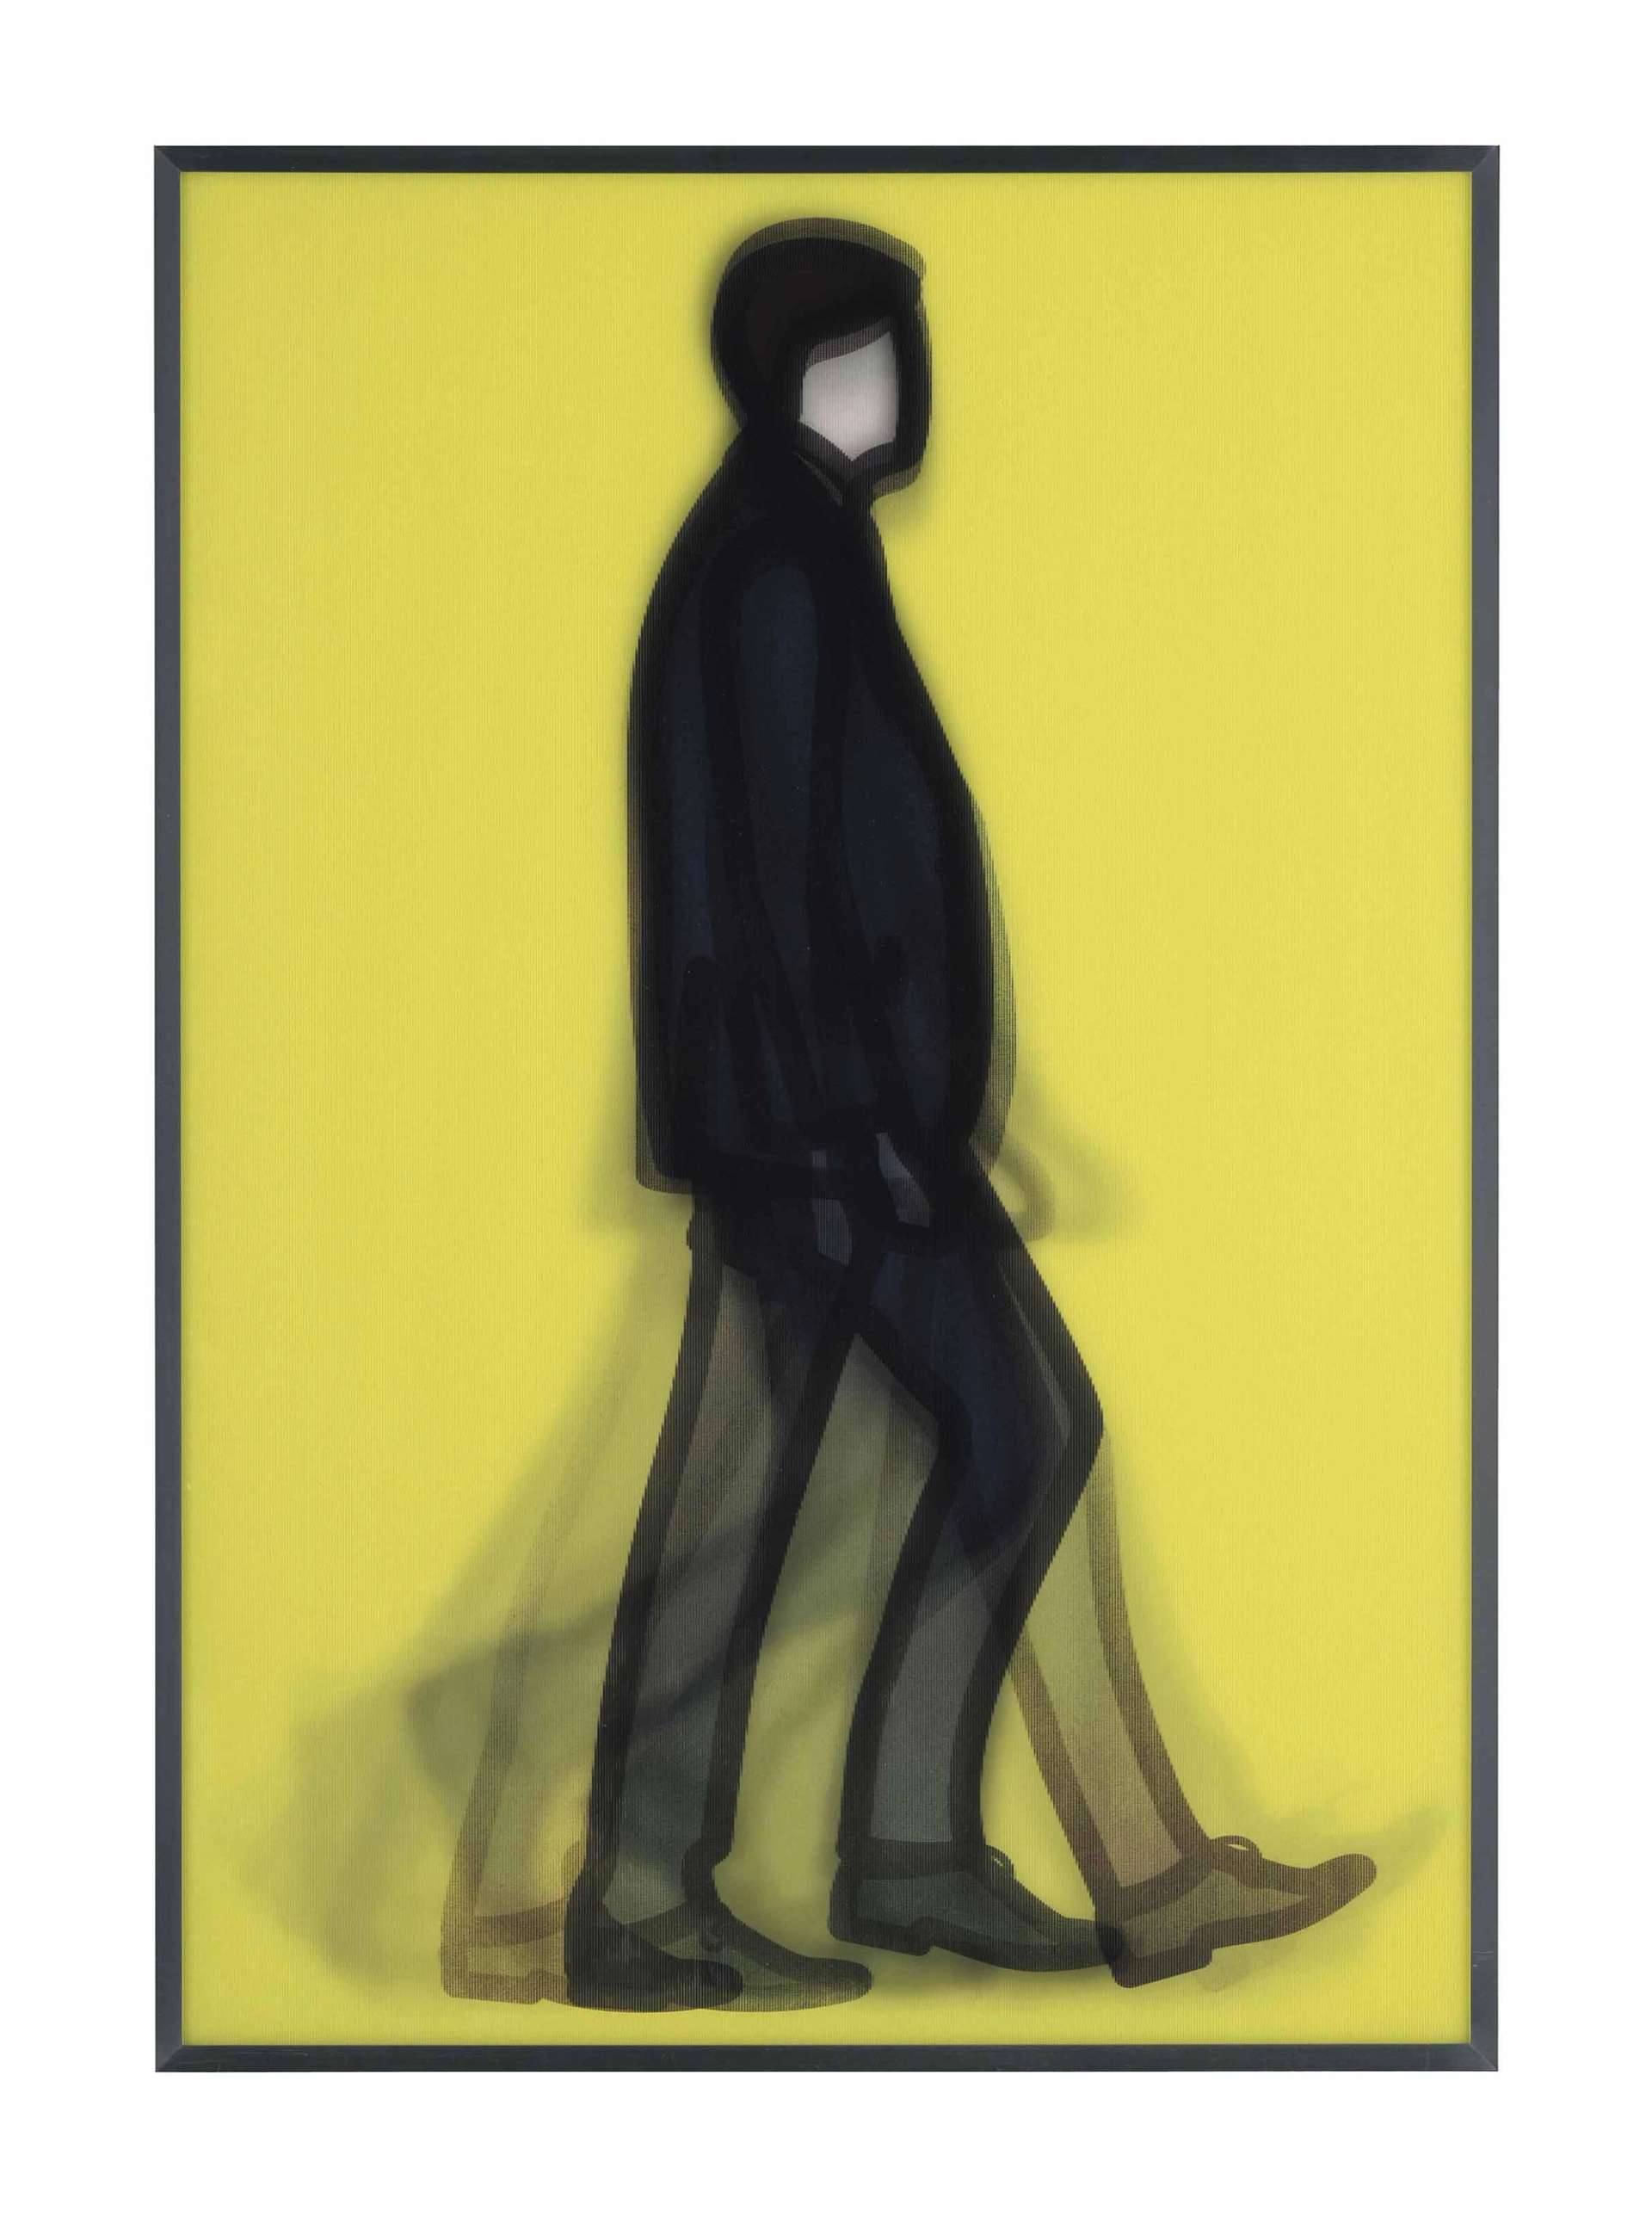
Opie: Steady Market Growth
Opie bucked the COVID downturn pattern shown by many artists' secondary market. Despite a total market size contraction in 2022, ASP has continued to grow consistently over the past three years.
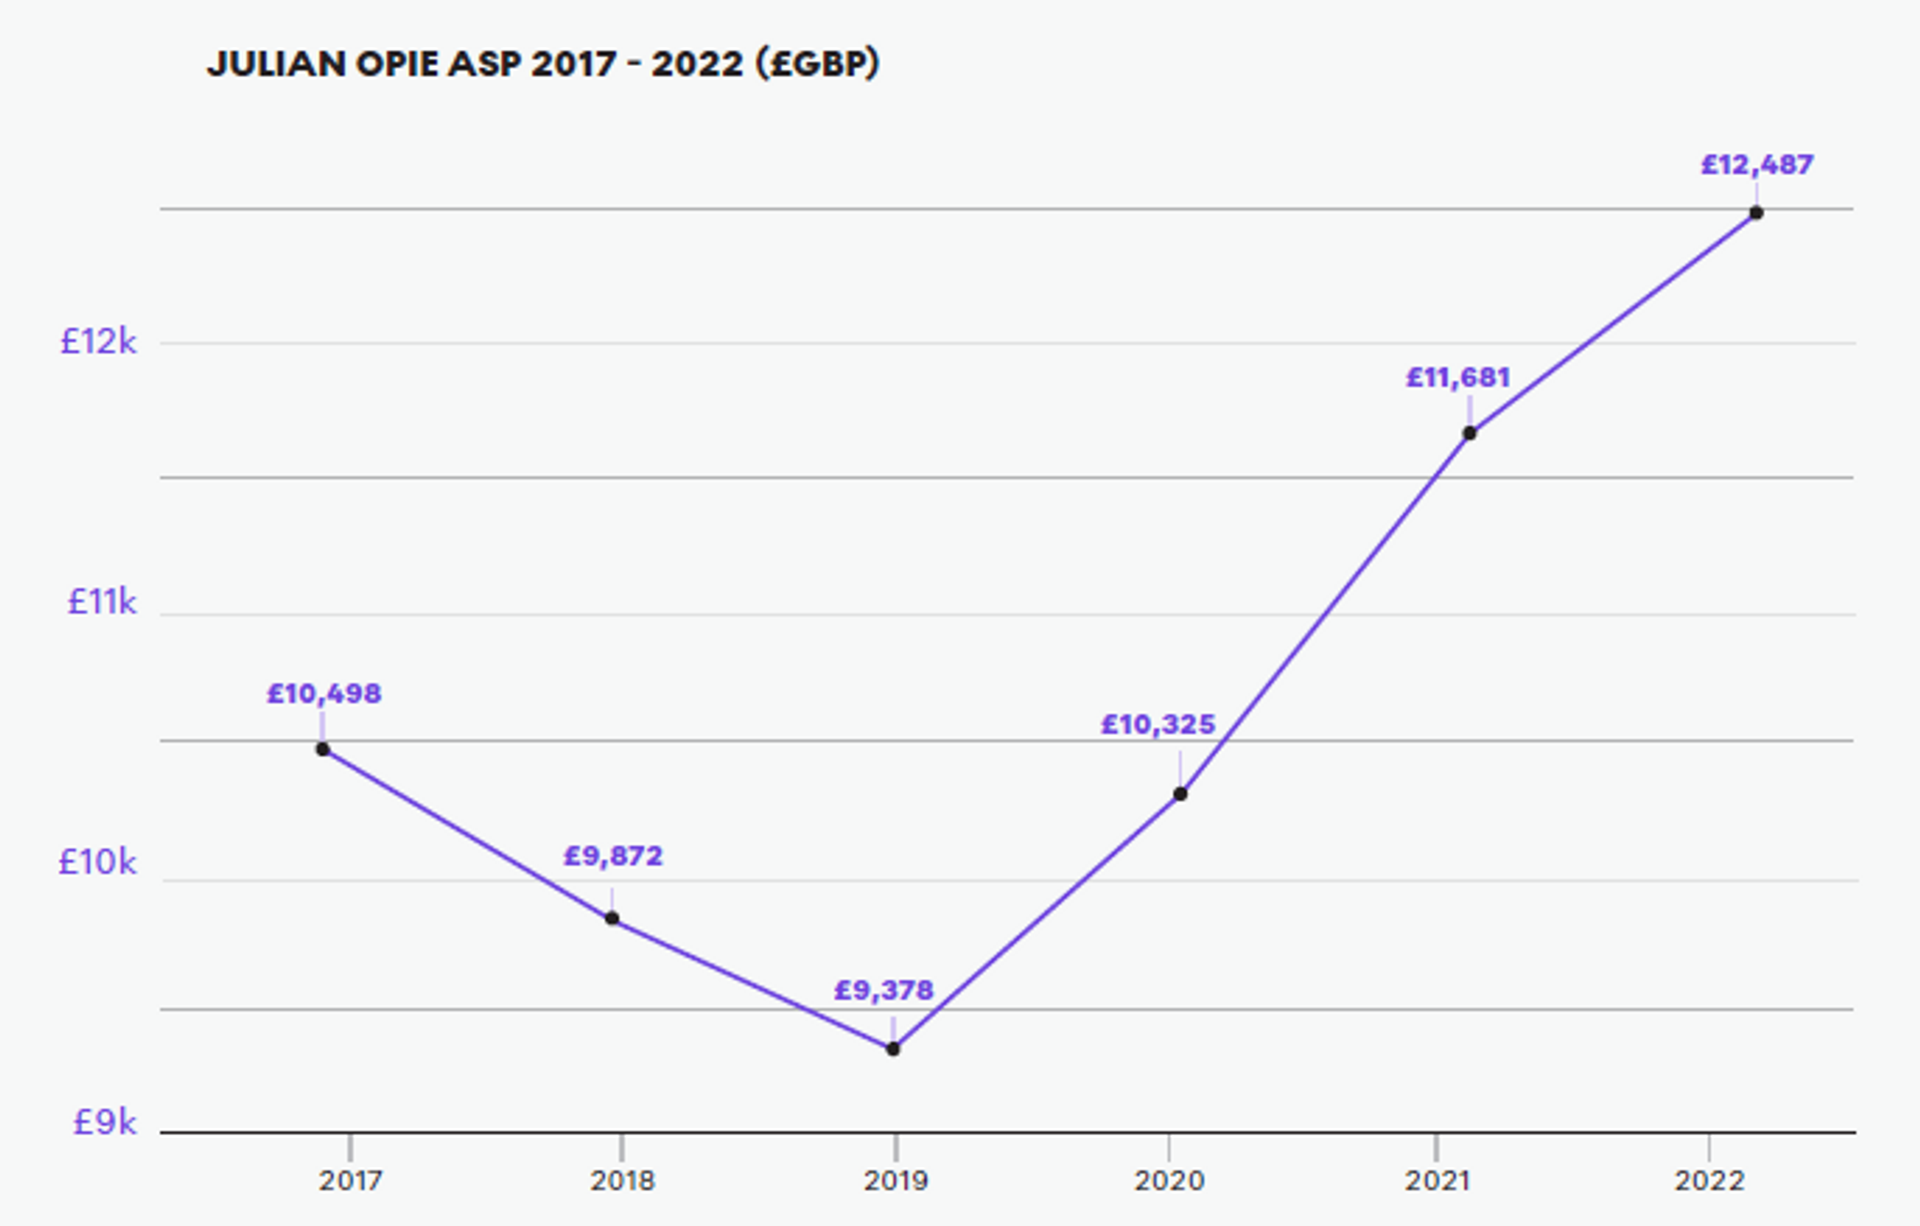 Julian Opie ASP £GBP
Opie sales volumes are relatively small, hence when prints do become available, competition remains strong enough to keep ASPs steadily trending upwards. It’s still a relatively accessible market and a favourite of greener collectors with lighter budgets.
Browse Julian Opie prints.
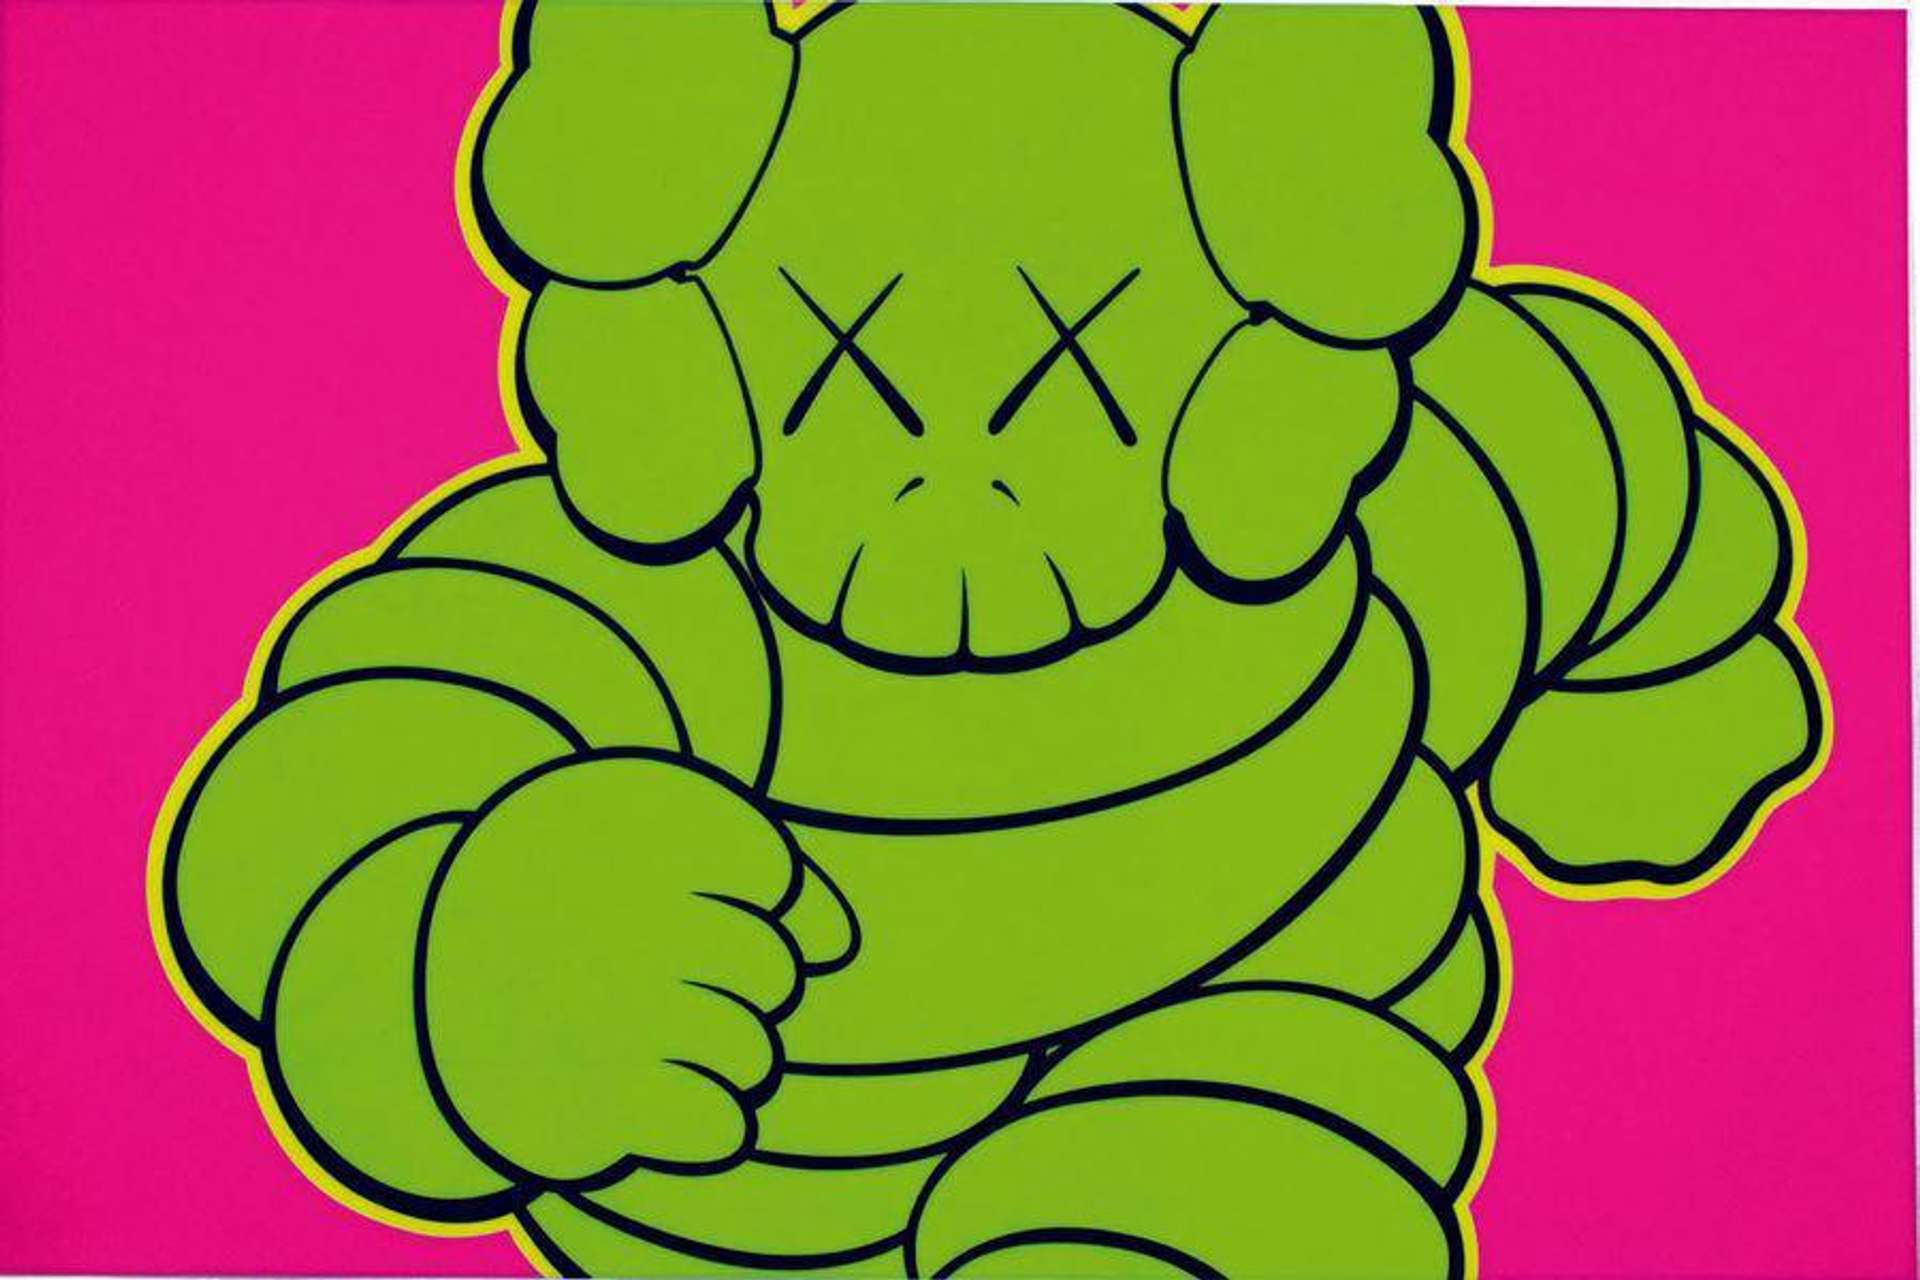
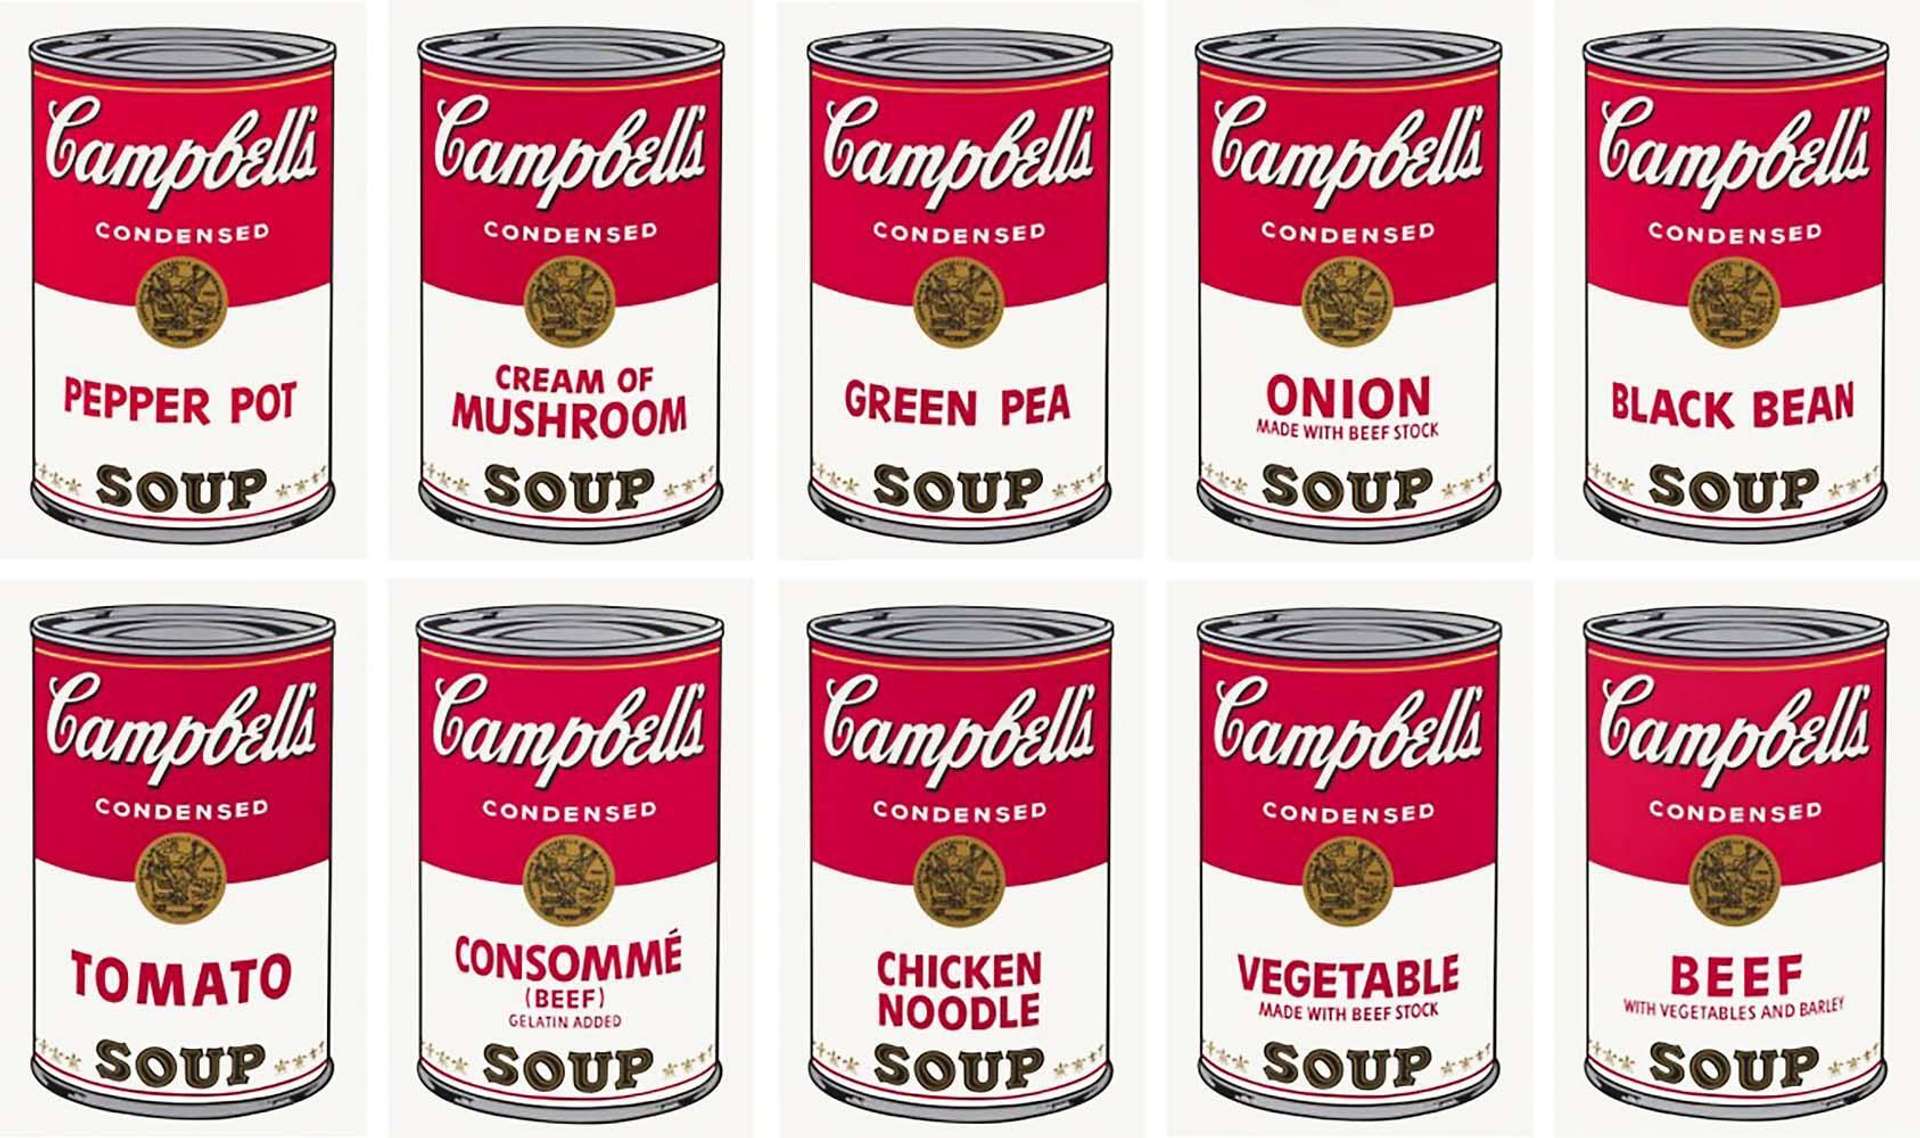
KAWS: A Long Term Investment Opportunity
Over-commercialisation may have affected KAWS’ perceived value with established collectors. ASP has been on a downward trend since 2019, pre-COVID. That said, there is an opportunity to acquire rare and limited works during this down period with a long-term view.
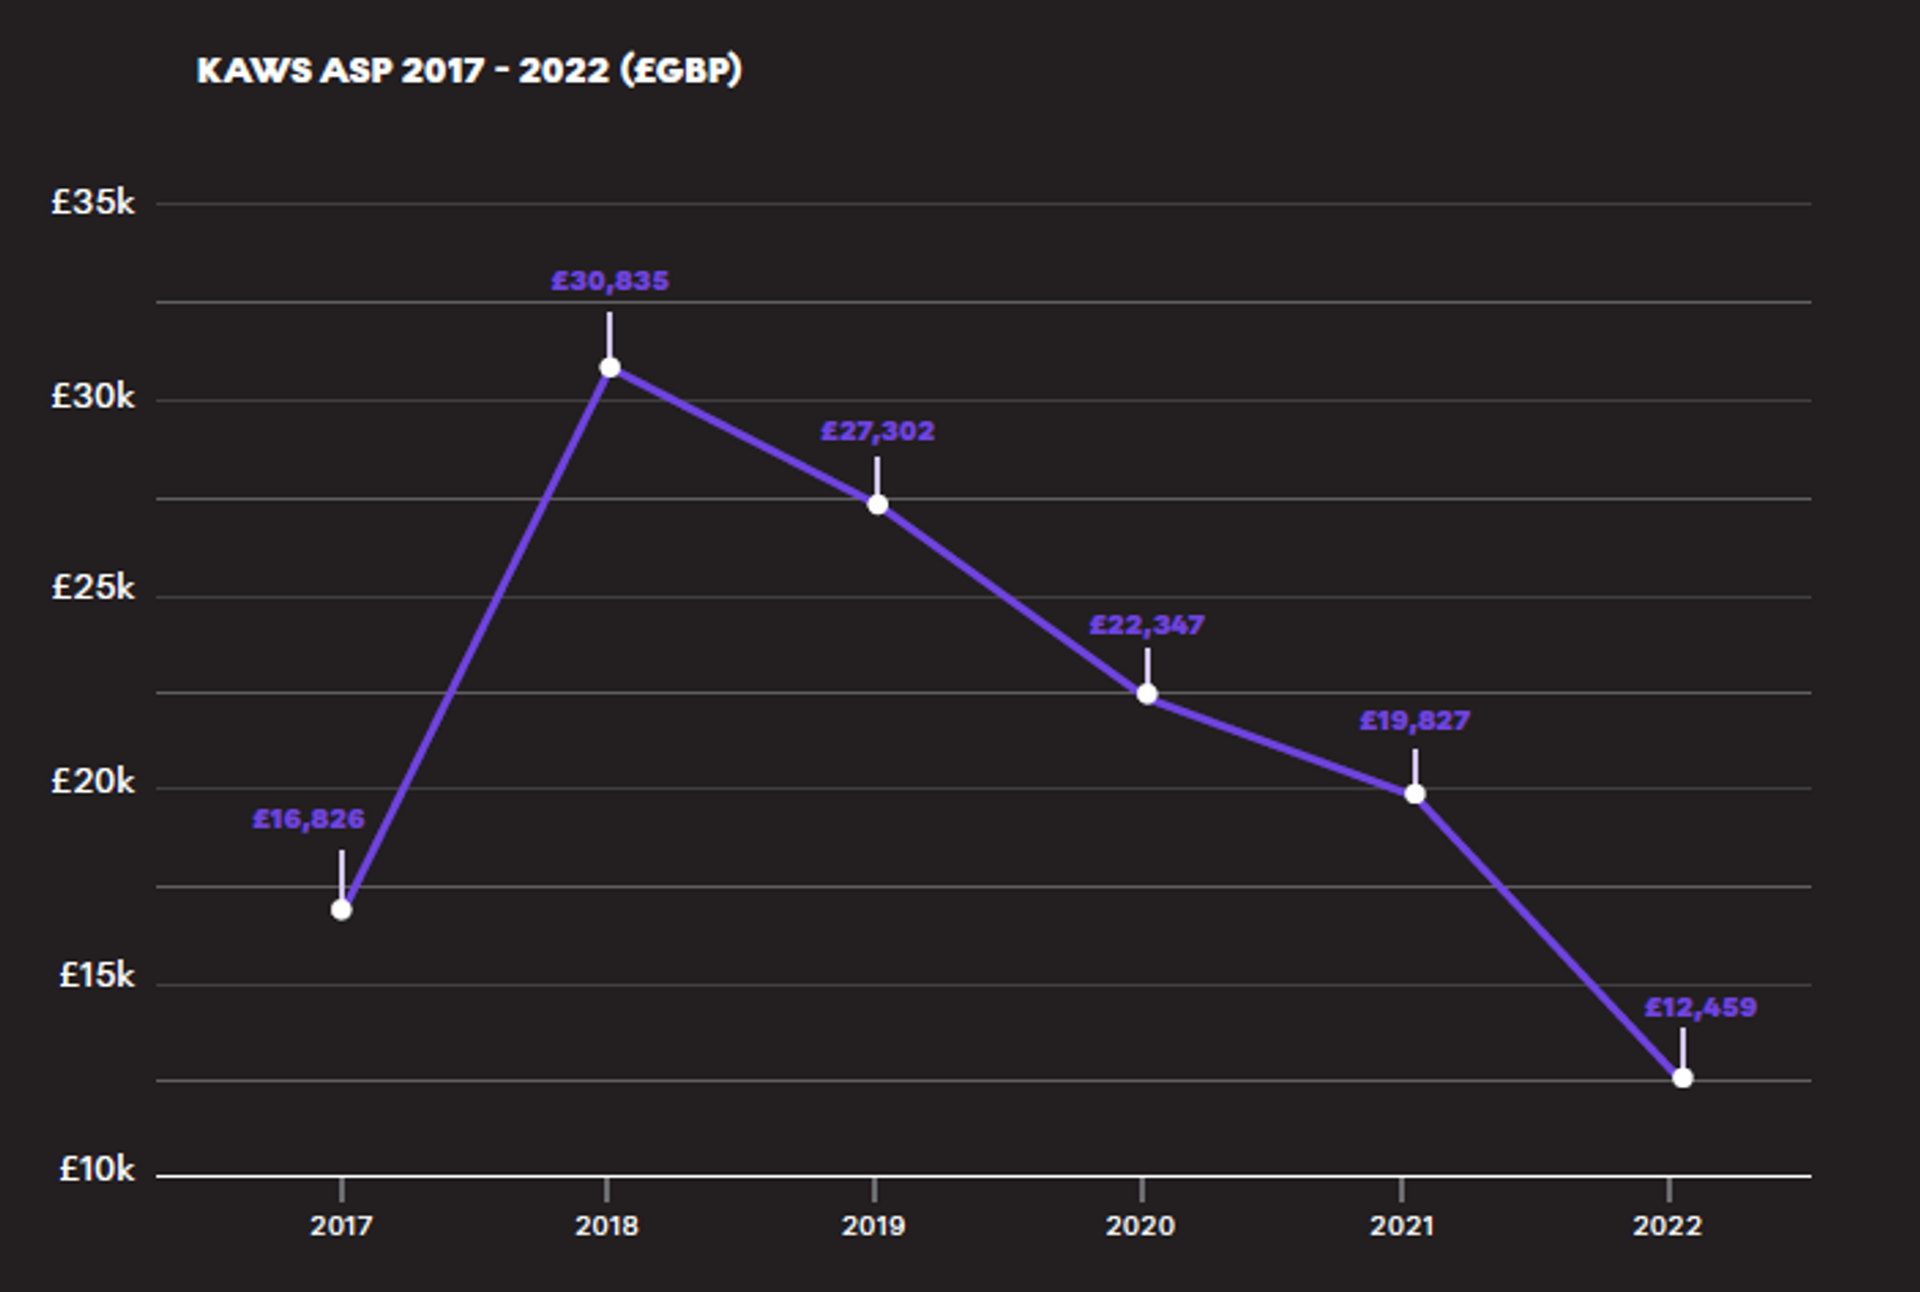 KAWS ASP £GBP
Browse KAWS prints.
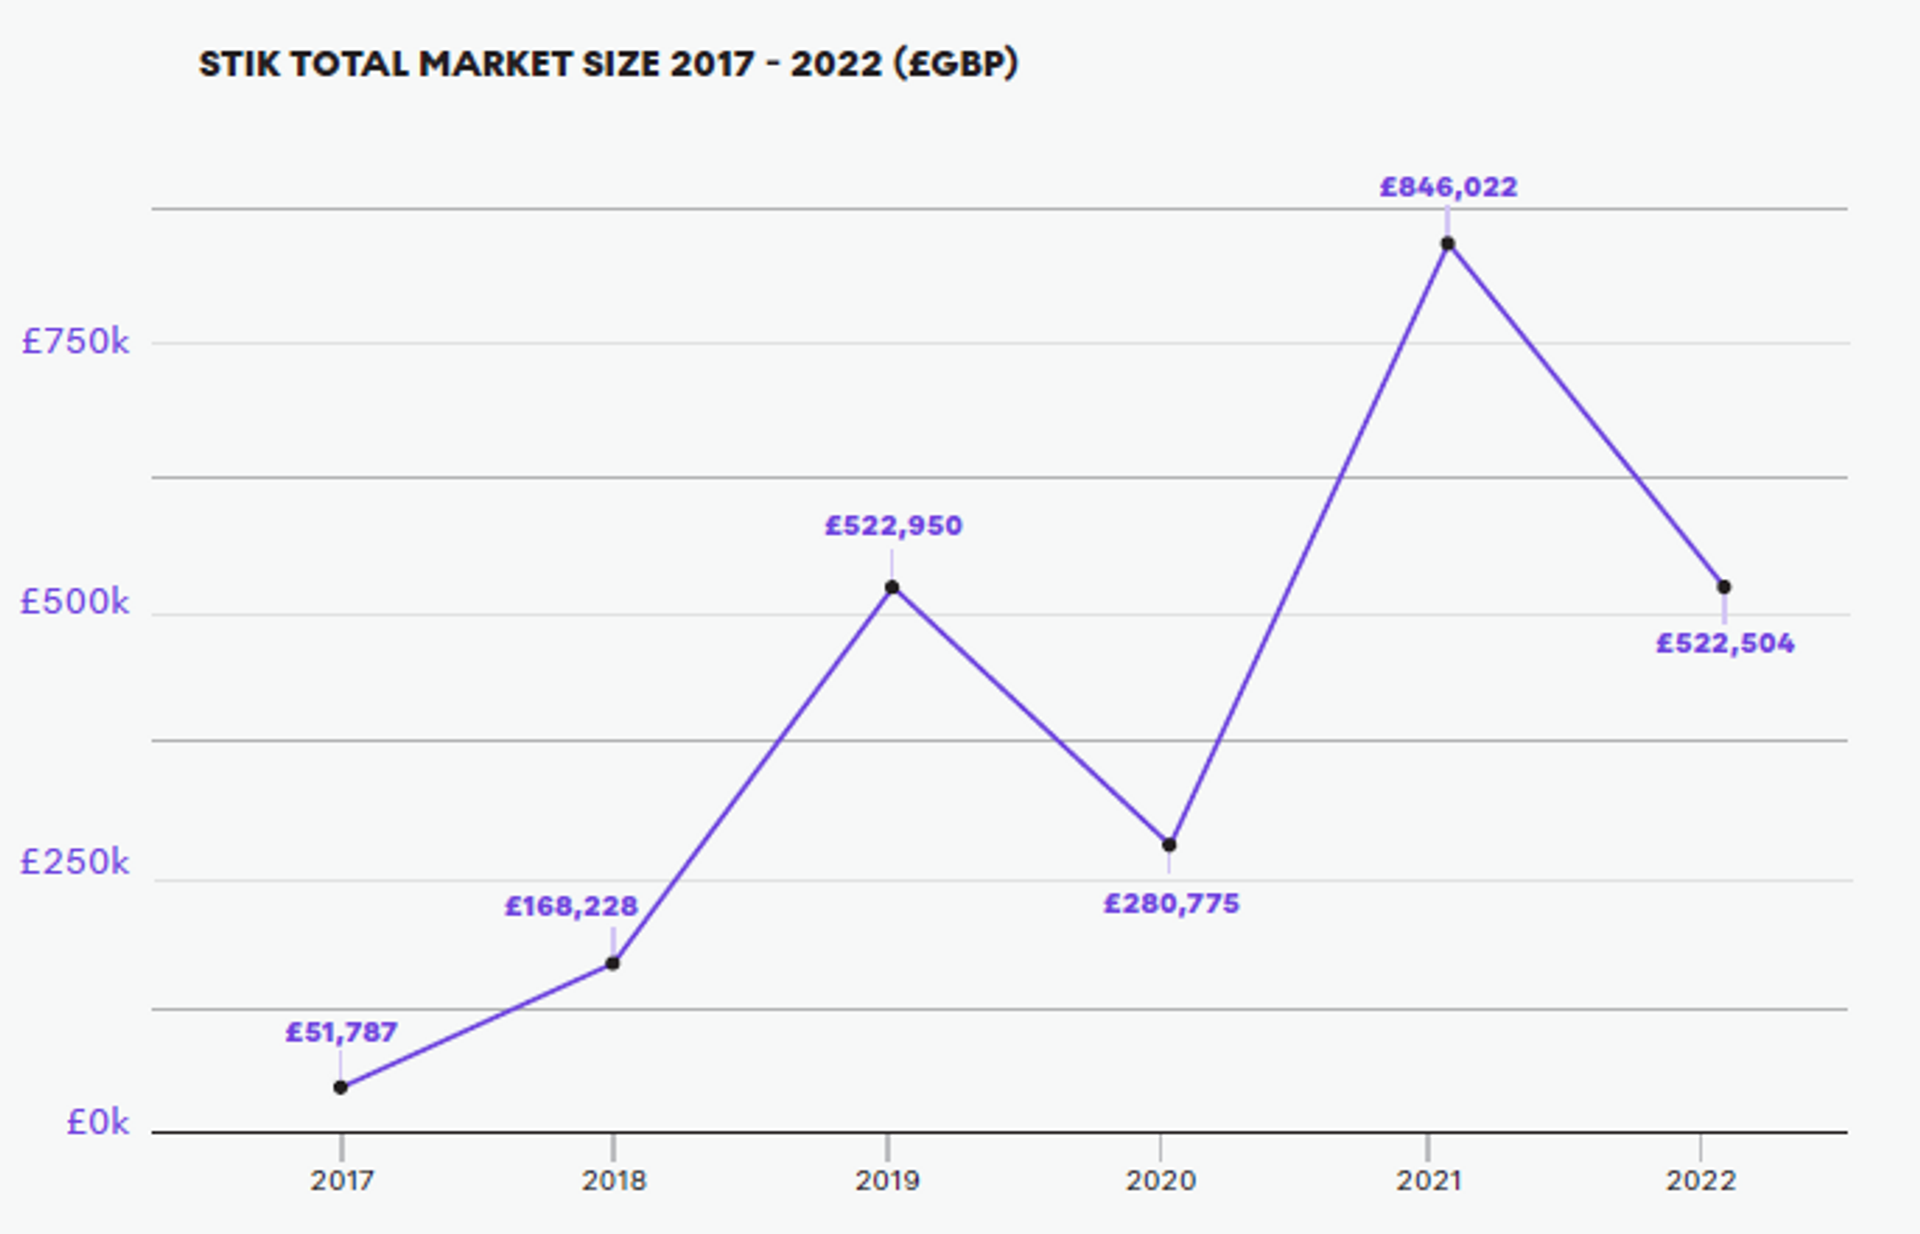 STIK’s Total Market Size in £GBP
The Stik Market Correction
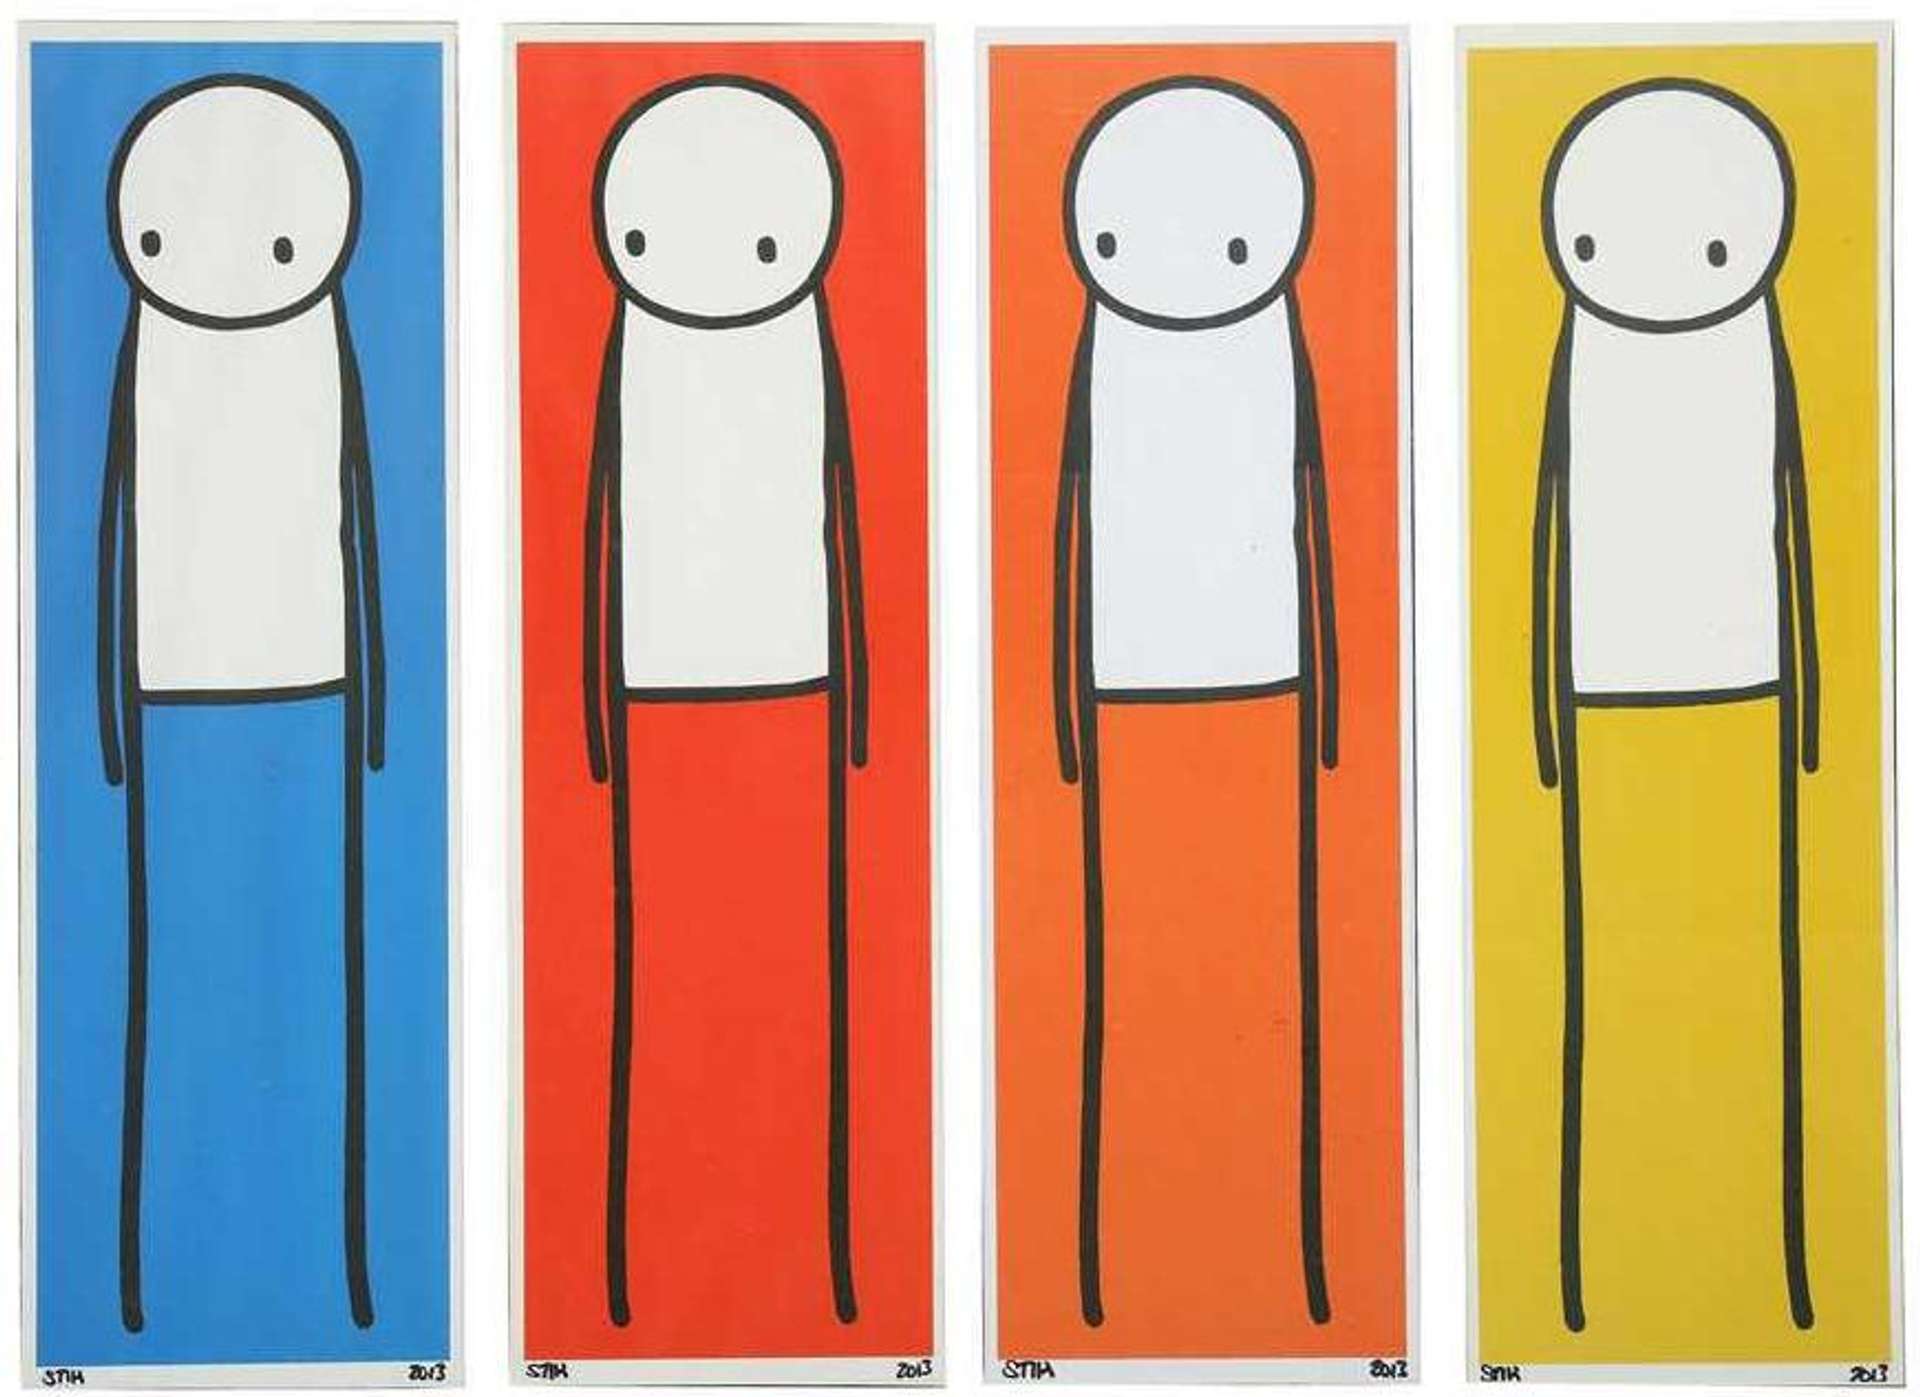
Stik has been subject to dramatic growth but is also subject to volatility in the face of economic uncertainty. Navigating the peaks and troughs is key for investors interested in this market. Bouncing back from 2020 with a vengeance, the Stik market has taken a correction in 2022 accordingly.
Browse Stik prints.
Download our 2023 Market Report to discover more expert opinions on the prints and multiples market over the last five years. In this report, you can expect to find in-depth analyses of each artist’s print market, a list of the best-performing artworks on the market, and more print data that we have sourced just for you.
As the only dedicated prints & editions platform, we are committed to helping our clients make educated decisions about buying something they love and selling when the time is right; our combination of private sales, our vast network of collectors, and our precision data, offer autonomy and guidance in these matters unlike any other.
Find out more about Urban & Contemporary prints as alternative investment assets in our Ultimate Print Market Report.