MyArtBroker’s Print Market Index
The art market has undergone profound structural change since 2020. The pandemic accelerated a digital transformation that reshaped how art is bought, sold, and valued. What was once a private, opaque ecosystem increasingly operates within digital frameworks where data accessibility, online bidding, and transparency are now expected norms. This same transformation has reached the secondary market for prints – a segment uniquely suited to quantifiable analysis because of its inherent comparability across editioned works.
Recognising that opportunity, MyArtBroker created the MAB100 to bring the same level of analytical insight to prints that the S&P 500 brings to equities – offering a clear, data-driven benchmark for collectors, analysts, and institutions.
MAB100: What Is a Print Market Index?
In the simplest terms, an index measures how the value of a group of assets changes over time. Just as a stock index reflects shifts in company performance, the MAB100 reflects shifts in the value of blue chip editioned prints.
It is the first index to track the top 100 most actively traded prints, ranked by cumulative auction spend and repeat-sale depth over the past five years. These are not the most famous or expensive works – they are the most measurable. The MAB100 identifies the prints with enough trading history to accurately model performance across market cycles.
The ranking refreshes quarterly, ensuring the index reflects the prints that genuinely define the liquidity and momentum of today’s print market.
Why the Top 100 Matters – and Why Certain Artists Rank
The “100” in the MAB100 refers to the works with the deepest and most transparent transaction histories – the artworks that trade often enough to produce statistically meaningful insights.
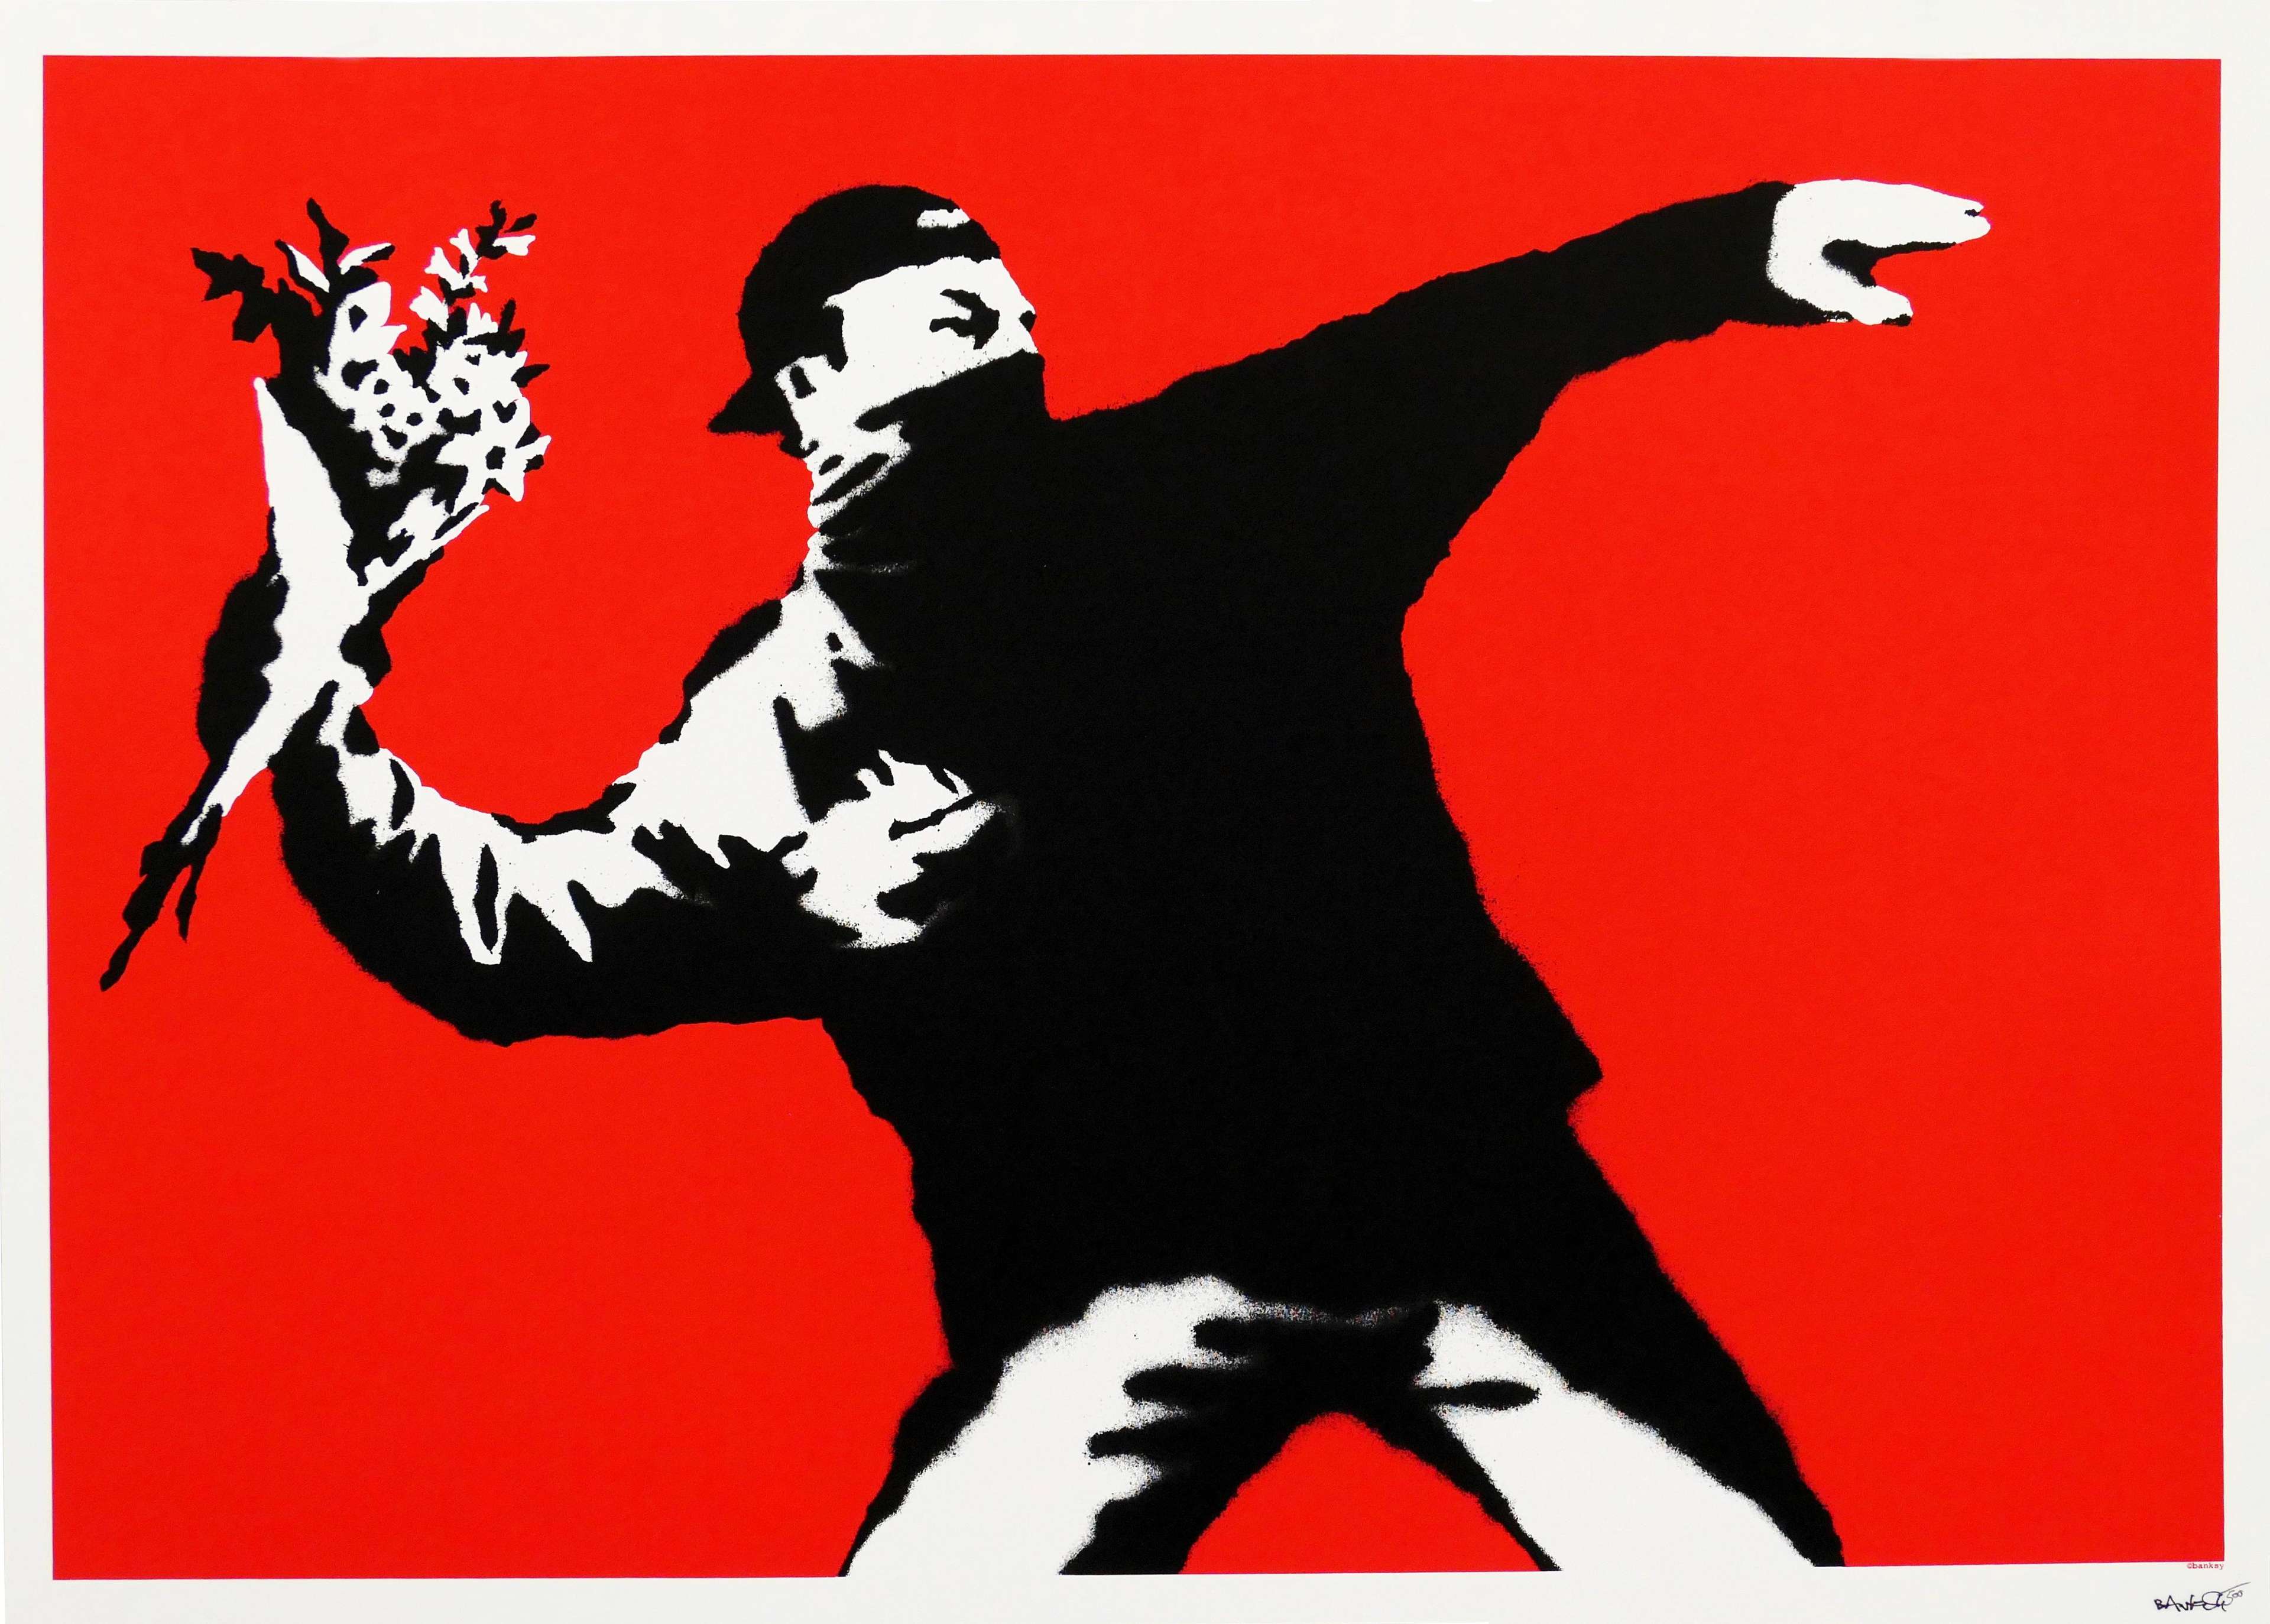
That’s why artists such as Banksy, Warhol, Lichtenstein, Hockney, and Kusama dominate the rankings. Their print markets are not just valuable; they are active, broad, and globally distributed, creating the dense repeat-sale data that allows performance to be measured reliably.
By contrast, artists whose prints rarely trade publicly, or whose markets exist primarily through private channels, appear less frequently. Their omission doesn’t imply lesser significance – it simply reflects a lack of sufficient data to calculate consistent trends.
For example, in the October 2025 rankings, Banksy’s Girl With Balloon and Love Is In The Air sit at the top of the list. Both have experienced price corrections since 2021, yet within this index their strength lies not in short-term appreciation but in frequency, consistency, and data reliability. These are among the most repeatedly sold and documented works in the market, across multiple auction houses and time periods. That breadth of verified data – not just volume – makes them statistically central to measuring real market confidence.
In that sense, the MAB100 doesn’t track celebrity or peak prices – it tracks circulation. It identifies the artworks that define liquidity: where buyers and sellers continue to meet, and where price discovery is most active. These are the works through which the health of the market can genuinely be observed.

How the MAB100 Works
At its core, the MAB100 is a Repeat-Sales Regression (RSR) index built exclusively from verified auction results. Every time the same print sells twice, it creates a price pair. For example, if a work sold for £10,000 in 2019 and £15,000 in 2024, that’s a 50% increase. The model aggregates thousands of these price pairs across different artists and time periods to measure how the overall market has changed.
To ensure statistical accuracy, the MAB100 isolates price movement by tracking identical works over multiple sales rather than comparing different works. This controls for differences in size, medium, and rarity, creating a clean picture of price evolution over time.
The index is rebased to 100 at the starting point. A value of 120 indicates that the market has risen 20% since baseline, while a value of 85 means it has fallen 15%. To prevent short-term volatility from distorting trends, the MAB100 applies a 360-day rolling average, smoothing out seasonal fluctuations and focusing on genuine market movement.
It’s conceptually similar to tracking home prices in a neighbourhood or stock performance in an index fund – a clear, percentage-based signal of whether the market as a whole is rising or falling.
Where SingularityX Fits In
While the MAB100 tracks aggregate market performance using only historic auction data, the SingularityX algorithm underpins MyArtBroker’s broader valuation capabilities.
SingularityX sources from over 400 auction houses and integrates more than 40 additional variables – including private-sale benchmarks, artist trends, proof and portfolio relationships, and edition variations such as colourways and hand-finishing. This expanded dataset allows for real-time valuation estimates that account for both public and private market dynamics.
Together, the two systems create a dual framework:
- The MAB100 measures long-term market movement, tracking liquidity and price evolution through repeat sales.
- SingularityX measures individual artwork value in real time, considering wider market factors that influence pricing.
Market observers typically use varying timeframes within the MAB100 to distinguish long-term market trends (visible across five-year periods) from short-term market momentum (captured within 6-month or 30-day windows). These parallel perspectives allow users to identify both structural growth and near-term inflection points.
Why Prints Provide the Perfect Test Case
Prints are uniquely suited to this level of data precision. Because they exist in numbered editions, they offer the closest possible apples-to-apples comparison in the art world. While condition, colourway, and provenance can influence pricing, the underlying edition structure allows for far cleaner and more consistent measurement than any other medium.
By focusing exclusively on blue chip artists with well-documented secondary markets, the MAB100 isolates a segment where transparency and comparability are highest. It transforms what was once anecdotal – “the market feels up” – into something measurable: “the market is up 12% since baseline.”
A Step Toward a More Credible Art Market
For too long, art-market data has been fragmented, reactive, and overly reliant on headline sales. The MAB100 offers a credible, quantitative foundation for understanding how the print market evolves over time – one built on repeatable data and transparent methodology.
By tracking performance across artists and editions, it provides an objective view of how confidence moves within one of the market’s most dynamic and accessible categories.
For collectors, it’s a reference point. For analysts, it’s a benchmark. For the wider art world, it’s a step toward a more transparent and measurable market.